Candlestick basics show how price moved within each session, helping commodity traders spot momentum, reversals, and entry or exit signals faster.
In this guide to understanding basic candlestick charts, we’ll show you what this chart looks like and explain its components. We also provide an index to other specialized types of candlestick analysis charts.
What Are Candlestick Charts?
Candlestick charts are an effective way of visualizing price movements invented by a Japanese rice trader in the 1700s.
Astute reading of candlestick charts may help traders better understand the market’s movements.
How to Read Candlestick Charts
Candlesticks summarize a period’s trading action by visualizing four price points:
| Open | Price at the beginning of the period |
| Close | Price at the end of the period |
| High | The maximum price achieved during that period |
| Low | The lowest price of the asset during the period |

What Are the Parts of a Candlestick Chart?
There are three main parts to a candlestick:
Upper Shadow: The vertical line between the high of the day and the closing price (bullish candle) or open (bearish candle)
Real Body: The difference between the opening price and closing prices. This is shown by the colored portion of the candlestick.
- A green (or white) body indicates that an asset’s price moved higher over the day’s trading.
- A red (or black) body indicates that prices ended lower than they were at the day’s opening.
Lower Shadow: The vertical line between the low of the day and the open (bullish candle) or close (bearish candle)
How to Interpret Price Movement on a Candlestick Chart
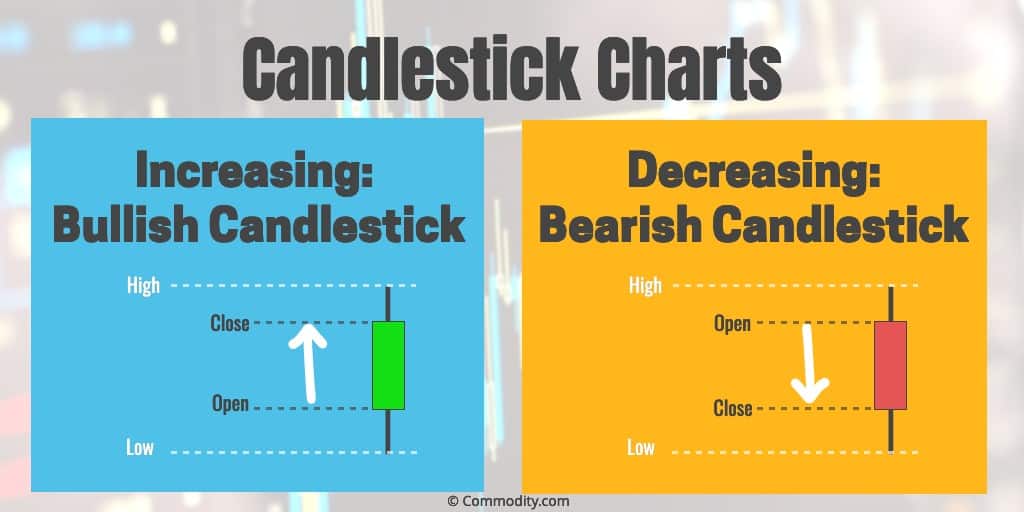
There are two basic candlesticks which are illustrated on the image above:
- Bullish Candle: When the close is higher than the open (usually green or white)
- Bearish Candle: When the close is lower than the open (usually red or black)
More Candlestick Patterns
Candlestick patterns can be made up of one candle or multiple candlesticks. They can also form reversal or continuation patterns.
Here are some of the most popular candlestick charts, explained:
- Bullish Engulfing Pattern
- Bearish Engulfing Pattern
- Dark Cloud Cover
- Doji
- Dragonfly Doji
- Evening Star
- Gravestone Doji
- Hammer
- Hanging Man
- Harami
- Inverted Hammer
- Morning Star
- Piercing Pattern
- Shooting Star
- Tweezer Tops & Bottoms
- Windows
Interested in Trading Commodities?
Start your research with our introduction to trading commodities, or reviews of these regulated brokers available in . Learn which technical analysis tools their platforms offer or start practicing with free demo accounts available at many brokers:
FAQs
Here are some answers to common questions about candlestick charts.
Which candlestick pattern is most reliable?
Two of the most reliable candlestick patterns are the Morning Star (bullish reversal pattern) and Evening Star (bearish reversal pattern) indicators. They rely on three days’ worth of pricing to identify a trend that may signal a reversal. Engulfing patterns (bearish or bullish) are also fairly reliable since they compare two-day trends.
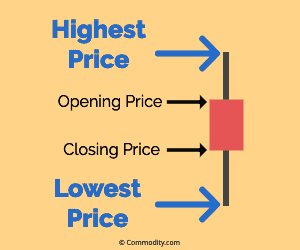
What do the wicks on candlestick charts mean?
As shown in the graphic below, the top wick of a candlestick indicates the highest price reached during the time period (eg, a day). The bottom wick shows the lowest price. The “candle” part of the chart shows the opening and closing prices for the time period.
Further Reading on Reversal Patterns
These reversal tools complement Candlestick Basics: Bearish Engulfing Pattern, Evening Star, and Inverted Hammer.
Technical analysis is most widely used in CFD and forex trading. If you’re ready to apply these techniques, browse our vetted CFD brokers or forex brokers.

Update history
This page was revised 15 times between May 2020 and April 2026.
Added cross-promotion links to CFD and forex broker listings in Further Reading section.
Reorganized Further Reading section to focus specifically on reversal patterns, removed broker comparison table and general technical analysis topics.
Restructured candlestick pattern list with improved formatting and added two new introductory bullet points clarifying bearish candle definitions.
Reorganized list formatting in candlestick patterns and further reading sections, updated broker table reference, and refined definitions in two introductory sections.
Added reference to commodities trading introduction to guide readers toward foundational knowledge before broker selection.
Added reference to commodities trading introduction guide in the call-to-action section.
Added guidance on evaluating technical analysis tools and demo account availability when selecting brokers.
Added guidance to explore brokers' technical analysis tools and demo accounts in the Interested in Trading Commodities section.
Added two paragraphs explaining Morning Star, Evening Star, and Engulfing patterns, plus detailed breakdown of candlestick anatomy.
Added two new FAQ answers explaining the reliability of Morning Star, Evening Star, and Engulfing patterns, plus clarification on candlestick wick meanings.
Added introductory section with chart overview, reorganized content with new headings, expanded definitions with historical context and video resource, and restructured pattern explanations with improved clarity throughout.
Expanded guide with new introductory section, detailed breakdown of candlestick components, embedded video tutorial, FAQ section, and related resources on technical analysis.
Added call-to-action alert component to the Interested in Trading Commodities section.
Removed lengthy disclaimer footer from Candlestick Basics article.
Added explanatory section on three main candlestick components, corrected spelling error ("explaination" to "explanation"), and reorganized content for better flow.
The Commodity Briefing
The stories behind the prices. Surprising, useful, occasionally weird - in your inbox every weekday.
- Price moves
- Supply shocks
- Macro drivers
Before you go
Get The Commodity Briefing - free, 2 minutes.