
In its first year, the Biden Adminisaretration has embarked on an aggressive domestic agenda intended to offer a variety of economic support to lower- and middle-class Americans. The American Rescue Plan, passed in March, included direct payments to U.S. households, new investments into safety net programssafety-net programs like food stamps and unemploymentunemployment benefits, and increases to the Earned Income Tax Credit and Child Tax Credit.
The Biden Administration followed this just a few weeks later with two proposals, the American Jobs Plan and the American Families Plan, which would dramatically scale up federal spending on a variety of programs for infrastructure, job creation, education, child care, health, food assistance, and tax relief.
Biden’s agenda has prioritized a strong role for the federal government, in offering in offering financial support to needy Americans and creating pathways to the middle class.
This agenda would represent a new chapter for the U.S. welfare state, building beyond the New Deal programs introduced in the 1930s and the Great Society programs enacted in the 1960s. These earlier programs created a wide-ranging role for the government in protecting disadvantaged citizens from economic harm. Today, public welfare encompasses a variety of government programs whose benefits are contingent on need, such as Medicaid, Temporary Assistance for Needy Families (TANF), and Supplemental Security Income (SSI).
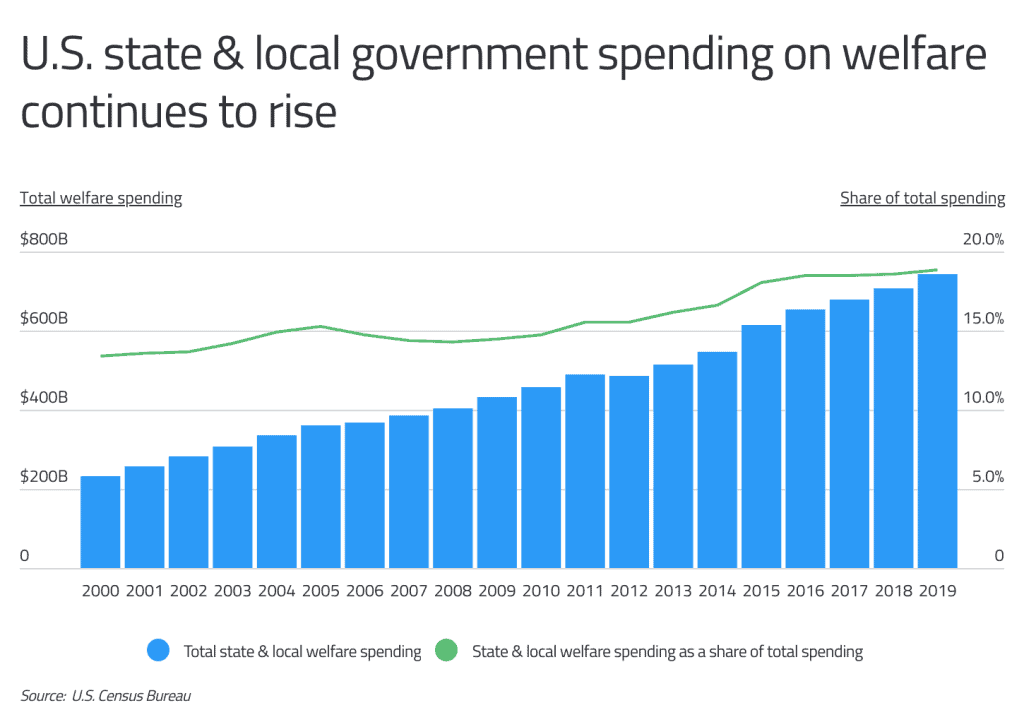
Because these programs are typically based on demographic and economic factors, they have grown with shifts in the population and economy over time. According to the Census Bureau, in the last 20 years alone, state and local welfare spending has more than tripled in nominal dollars, rising from $233 billion nationally in 2000 to $743 billion in 2019.
As a share of total spending, welfare spending has risen from 13.4% of state and local budgets at the start of the millennium to 18.8% in 2019. But even on a per capita basis, spending is up nearly 180% over that span.
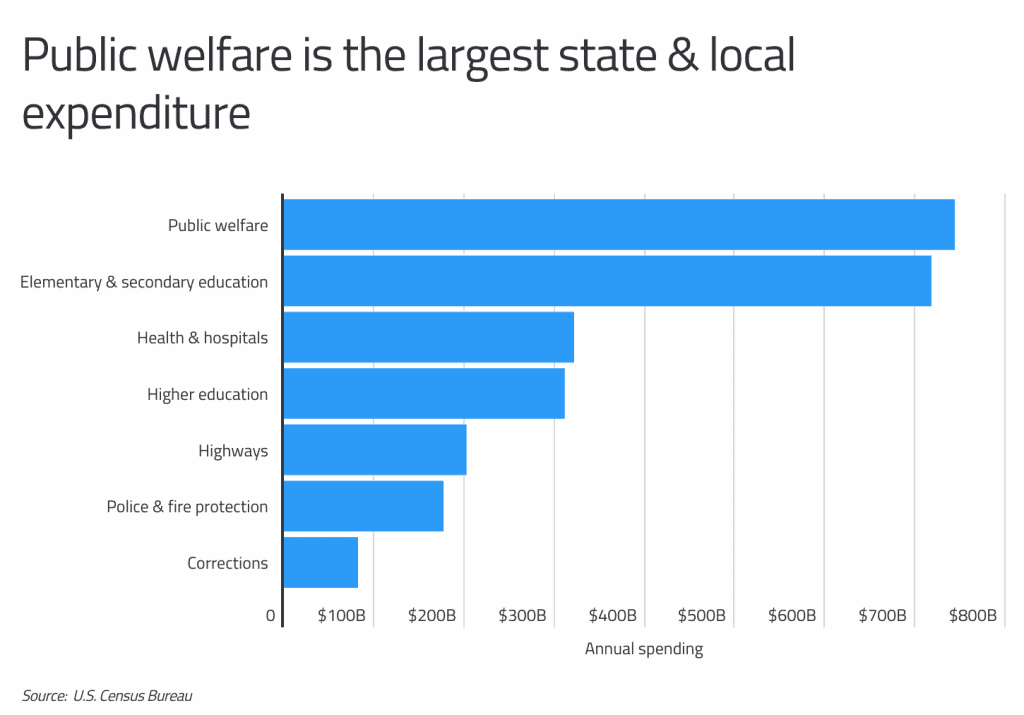
And in comparison to other budget items, public welfare is now the single largest category of expenditure in state and local budgets.
Welfare spending totals $743 billion, narrowly topping elementary and secondary education spending ($717 billion) and running far ahead of other categories like higher education, highways, and protective services.
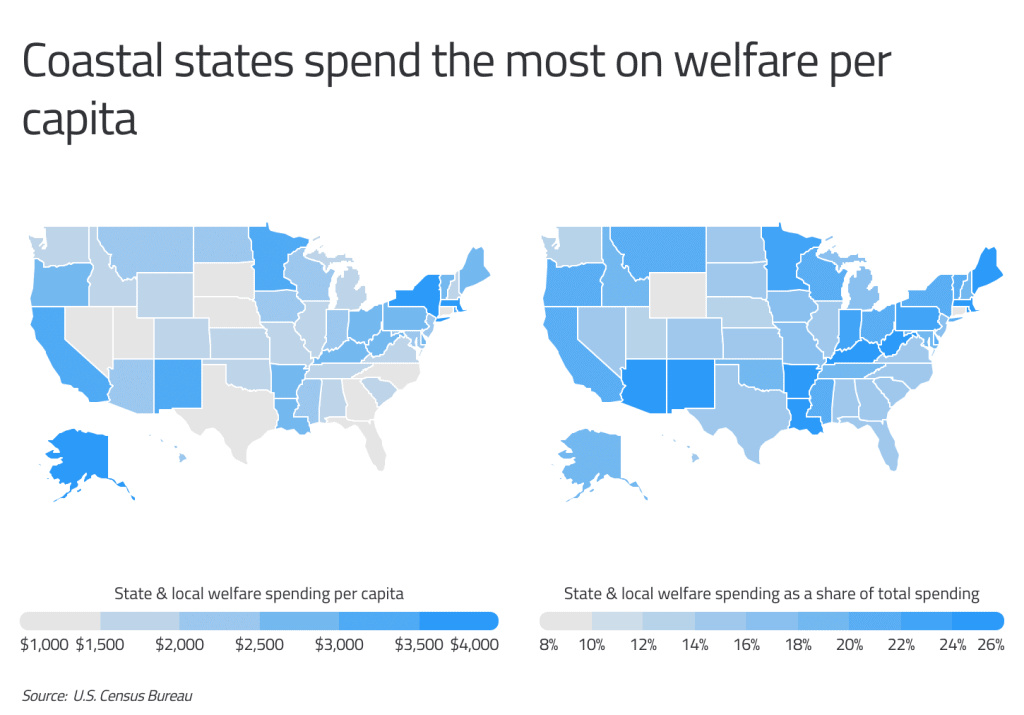
While the role of state and local government in welfare spending has grown everywhere, some states invest more than others in welfare programs. There are a variety of reasons why this is the case.
For one, states with more liberal politics may choose to invest a greater amount in social safety net programs, which is why many coastal states have greater per-capita welfare spending, led by New York at $4,094.
Another source of disparities between states is their underlying population or economic characteristics. For instance, states like Arkansas, West Virginia, and Kentucky all spend more than a quarter of their budgets on welfare spending, which is likely due to the fact that they have greater populations of low-income residents who are eligible for state-administered federal assistance programs like TANF or Medicaid.
RELATEDA Contracts-for-Difference (CFD) is a typeA Contract-for-Difference (CFD) is a type of financial product that allows traders to speculate on the price movements of an underlying asset like gold or oil instead of taking physical ownership of the product. Learn more about CFDs and brokers in our comprehensive CFD broker guide.
To determine the states spendingthe states’ spending the most on public welfare, researchers at Commodity.com calculated total state and local welfare spending per person using the most recent data available from the U.S. Census Bureau. Public welfare spending includes cash assistance payments, vendor payments, and other uncategorized payments administered by state and local governments.
Here are the states spending the most on welfare.
U.S. States Spending the Most on Welfare Per Capita

15. Maine
- State & local welfare spending per capita: $2,615
- State & local welfare spending as a share of total spending: 25.6%
- Total state & local welfare spending: $3,530,545,000
- Cash assistance payments: $51,375,000
- Vendor payments: $2,473,329,000
- Other public welfare: $1,005,841,000

14. Kentucky
- State & local welfare spending per capita: $2,640
- State & local welfare spending as a share of total spending: 25.3%
- Total state & local welfare spending: $11,820,221,000
- Cash assistance payments: $171,832,000
- Vendor payments: $10,704,128,000
- Other public welfare: $944,261,000

13. Delaware
- State & local welfare spending per capita: $2,681
- State & local welfare spending as a share of total spending: 20.5%
- Total state & local welfare spending: $2,645,564,000
- Cash assistance payments: $36,586,000
- Vendor payments: $2,276,331,000
- Other public welfare: $332,647,000

12. West Virginia
- State & local welfare spending per capita: $2,708
- State & local welfare spending as a share of total spending: 25.7%
- Total state & local welfare spending: $4,832,936,000
- Cash assistance payments: $49,058,000
- Vendor payments: $4,083,045,000
- Other public welfare: $700,833,000

11. Louisiana
- State & local welfare spending per capita: $2,723
- State & local welfare spending as a share of total spending: 24.8%
- Total state & local welfare spending: $12,647,298,000
- Cash assistance payments: $27,185,000
- Vendor payments: $11,793,321,000
- Other public welfare: $826,792,000

10. Pennsylvania
- State & local welfare spending per capita: $2,787
- State & local welfare spending as a share of total spending: 22.3%
- Total state & local welfare spending: $35,628,431,000
- Cash assistance payments: $1,591,270,000
- Vendor payments: $28,550,353,000
- Other public welfare: $5,486,808,000
DID YOU KNOW?
Plus500 is coming to the United States. For information about Plus500, like how to execute trades on your cell phone, how to read and customize charts, and for tips on how to minimize risk on Plus500, check out our detailed Plus500 review.

9. Oregon
- State & local welfare spending per capita: $2,861
- State & local welfare spending as a share of total spending: 20.1%
- Total state & local welfare spending: $12,135,117,000
- Cash assistance payments: $255,356,000
- Vendor payments: $7,309,385,000
- Other public welfare: $4,570,376,000

8. Vermont
- State & local welfare spending per capita: $2,988
- State & local welfare spending as a share of total spending: 21.5%
- Total state & local welfare spending: $1,862,528,000
- Cash assistance payments: $20,775,000
- Vendor payments: $1,164,720,000
- Other public welfare: $677,033,000

7. New Mexico
- State & local welfare spending per capita: $3,003
- State & local welfare spending as a share of total spending: 24.2%
- Total state & local welfare spending: $6,324,770,000
- Cash assistance payments: $54,620,000
- Vendor payments: $5,821,877,000
- Other public welfare: $448,273,000

6. Minnesota
- State & local welfare spending per capita: $3,012
- State & local welfare spending as a share of total spending: 23.6%
- Total state & local welfare spending: $17,039,955,000
- Cash assistance payments: $710,269,000
- Vendor payments: $13,688,638,000
- Other public welfare: $2,641,049,000

5. Rhode Island
- State & local welfare spending per capita: $3,107
- State & local welfare spending as a share of total spending: 24.0%
- Total state & local welfare spending: $3,284,006,000
- Cash assistance payments: $21,856,000
- Vendor payments: $2,960,598,000
- Other public welfare: $301,552,000
TRENDING
The quality of a trading platform is determined by its ease of use and the trading tools provided. Here are some more tips to consider when choosing a commodity broker.

4. California
- State & local welfare spending per capita: $3,403
- State & local welfare spending as a share of total spending: 21.1%
- Total state & local welfare spending: $133,978,520,000
- Cash assistance payments: $6,917,786,000
- Vendor payments: $108,643,810,000
- Other public welfare: $18,416,924,000

3. Massachusetts
- State & local welfare spending per capita: $3,574
- State & local welfare spending as a share of total spending: 25.0%
- Total state & local welfare spending: $24,639,146,000
- Cash assistance payments: $529,154,000
- Vendor payments: $22,154,310,000
- Other public welfare: $1,955,682,000

2. Alaska
- State & local welfare spending per capita: $3,811
- State & local welfare spending as a share of total spending: 18.6%
- Total state & local welfare spending: $2,786,410,000
- Cash assistance payments: $119,053,000
- Vendor payments: $2,323,495,000
- Other public welfare: $343,862,000
RELATED
Alaska is also high on the list of states most dependent on federal aid and the list of states with the most debt per capita.

1. New York
- State & local welfare spending per capita: $4,094
- State & local welfare spending as a share of total spending: 21.0%
- Total state & local welfare spending: $79,165,215,000
- Cash assistance payments: $2,589,581,000
- Vendor payments: $65,848,681,000
- Other public welfare: $10,726,953,000
Detailed Findings & Methodology
The data used in this analysis isare from the U.S. Census Bureau’s Annual Survey of State and Local Government Finances and the U.S. Census Bureau’s American Community Survey 1-Year Estimates, covering data from 2019.
To determine the states spendingthe states’ spending the most on public welfare, researchers calculated total state and local welfare spending per person using the most recent data available.
Public welfare spending includes cash assistance payments, vendor payments, and other uncategorized payments administered by state and local governments.
A full list of definitions from the survey can be found here.
!function(e,i,n,s){var t=”InfogramEmbeds”,d=e.getElementsByTagName(“script”)[0];if(window[t]&&window[t].initialized)window[t].process&&window[t].process();else if(!e.getElementById(n)){var o=e.createElement(“script”);o.async=1,o.id=n,o.src=”https://e.infogram.com/js/dist/embed-loader-min.js”,d.parentNode.insertBefore(o,d)}}(document,0,”infogram-async”);Update history
This page was revised 10 times between September 2021 and October 2021.
Replaced natural gas trading content with unrelated financial products (CFDs, Plus500) and commodity broker selection guidance.
Replaced three unrelated trading and finance advertisements with content about CFDs, Plus500, and commodity brokers, removing the original natural gas trading reference.
Simplified phrasing by removing "US" from two instances where context makes it redundant.
Removed redundant "US" references in Alaska section, changing "US states" to "states" twice for conciseness.
Added contextual cross-reference linking Alaska to related federal aid and per-capita debt statistics.
Added contextual cross-reference linking Alaska's welfare spending to related articles on federal aid dependency and per capita debt.
Removed redundant welfare definition paragraph and integrated a clearer, more specific explanation into the historical context section.
Removed introductory definition of public welfare and relocated it within the historical context paragraph, while updating terminology for greater specificity.
Added 14 photo credits throughout the article and restructured opening paragraph for better flow.
Added 15 photo credits throughout the article and restructured opening statement about welfare as largest budget category.
The Commodity Briefing
The stories behind the prices. Surprising, useful, occasionally weird - in your inbox every weekday.
- Price moves
- Supply shocks
- Macro drivers
Before you go
Get The Commodity Briefing - free, 2 minutes.