The COVID-19 pandemic has had enormous impacts on state and local governments by reducing tax revenue, causing widespread unemployment, and increasing healthcare costs.
In addition to reducing spending and, in some cases, raising taxes, state governments have relied on debt to address their budget shortfalls during the pandemic.
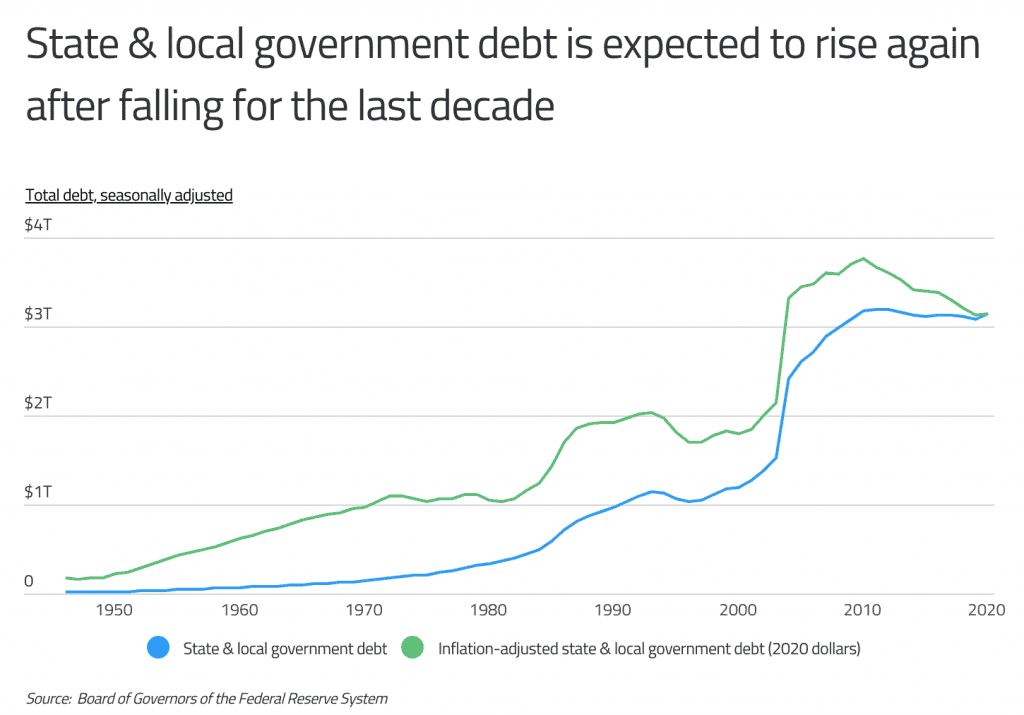
According to data from the U.S. Census Bureau, total state and local government debt was $3.17 trillion in 2019, or about $9,700 per person.
State governments use debt to finance education, infrastructure, and to cover budget gaps, among other things. State and local government debt can fluctuate due to spending habits or changes in income from taxes and other sources, such as during recessions. In the 1940s and 1950s, state and local government debt was much lower than today.
Federal, state, and local governments grew substantially during the 20th century. Spending, revenue, and debt increased as the population grew, and the government invested more in infrastructure, education, and social programs.
Leading up to the Great Recession that began at the end of 2007, total state and local government debt increased sharply. It has been falling since 2010 but increased between 2019 and 2020.
In the wake of the pandemic, the coming years will likely see a continuation of this trend. States with rising debt may raise taxes or cut spending to help bring their budgets under control.
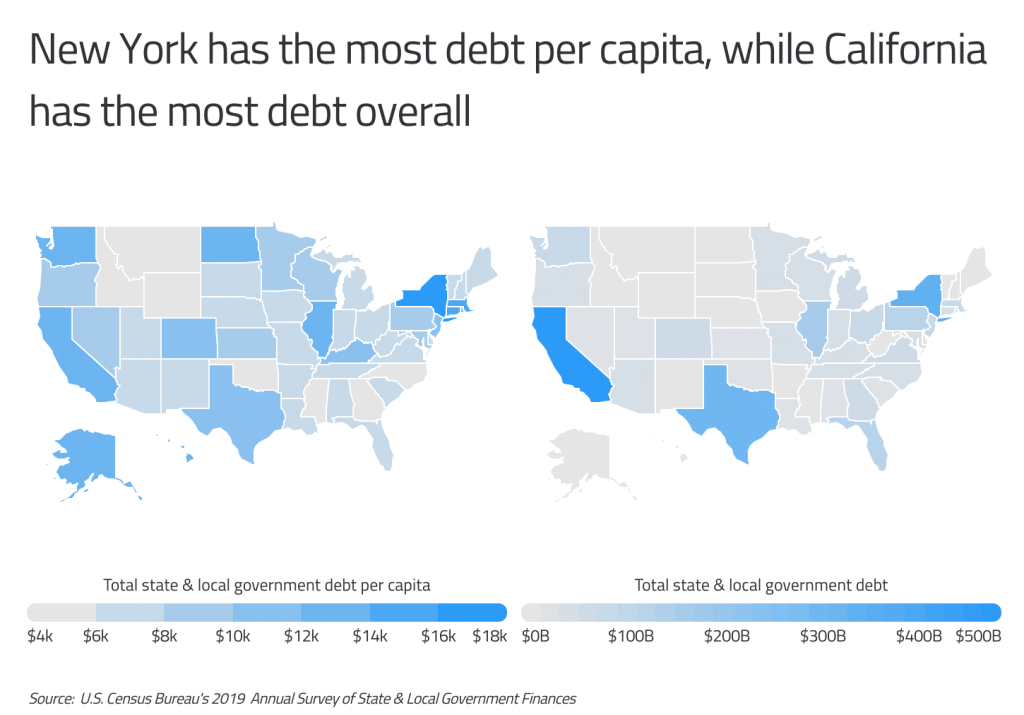
The amount of state and local government debt depends heavily on the population of the state, the amount of state employee retirement benefits, the size of social programs, and tax revenue.
As a result, states vary widely in their amounts of debt on both a total and per capita basis. While New York leads the country in terms of per capita government debt, at $18,411 per person, California, the most populous state, has the largest amount of total debt, at $507 billion.
RELATED
New York is also the highest of states ranked by welfare expenditure, though it is further down the list of states dependent on federal aid.
Conversely, Wyoming has both the lowest amount of total and per capita debt, at about $2 billion or $3,437 per person.
RELATED
More than 20 commodity CFDs are available to trade at Plus500. These include precious metals like gold, energy commodities like oil and gasoline, and agricultural commodities like wheat and coffee. Get started with our complete Plus500 review.
To find the states with the most state and local government debt, researchers at Commodity.com analyzed the latest data from the U.S. Census Bureau and the Bureau of Economic Analysis.
The researchers ranked states according to the total amount of state and local government debt per capita. Researchers also calculated total state and local government debt, total state government debt, total local government debt, and total state and local government debt as a percentage of state GDP.
Here are the states with the most state and local government debt per capita.
U.S. States With the Most Debt Per Capita

15. Pennsylvania
- Total state & local government debt per capita: $9,778
- Total state & local government debt: $125,178,460,000
- Total state government debt: $48,958,884,000
- Total local government debt: $76,219,576,000
- Total state & local government debt as a percentage of GDP: 15.5%

14. New Jersey
- Total state & local government debt per capita: $10,384
- Total state & local government debt: $92,231,421,000
- Total state government debt: $63,926,685,000
- Total local government debt: $28,304,736,000
- Total state & local government debt as a percentage of GDP: 14.5%
DID YOU KNOW?
Using an online broker provides investors with control and flexibility over their investments. For more information about brokers, be sure to visit our comprehensive guide to choosing a commodity broker.

13. Texas
- Total state & local government debt per capita: $10,410
- Total state & local government debt: $301,840,025,000
- Total state government debt: $53,794,342,000
- Total local government debt: $248,045,679,000
- Total state & local government debt as a percentage of GDP: 16.4%

12. Colorado
- Total state & local government debt per capita: $11,105
- Total state & local government debt: $63,953,107,000
- Total state government debt: $19,241,118,000
- Total local government debt: $44,711,988,000
- Total state & local government debt as a percentage of GDP: 16.3%

11. Rhode Island
- Total state & local government debt per capita: $11,283
- Total state & local government debt: $11,952,946,000
- Total state government debt: $9,275,273,000
- Total local government debt: $2,677,673,000
- Total state & local government debt as a percentage of GDP: 19.3%

10. Kentucky
- Total state & local government debt per capita: $11,885
- Total state & local government debt: $53,097,229,000
- Total state government debt: $15,346,875,000
- Total local government debt: $37,750,353,000
- Total state & local government debt as a percentage of GDP: 24.7%

9. Washington
- Total state & local government debt per capita: $12,416
- Total state & local government debt: $94,548,994,000
- Total state government debt: $35,584,686,000
- Total local government debt: $58,964,310,000
- Total state & local government debt as a percentage of GDP: 15.4%

8. Hawaii
- Total state & local government debt per capita: $12,512
- Total state & local government debt: $17,715,106,000
- Total state government debt: $10,001,827,000
- Total local government debt: $7,713,279,000
- Total state & local government debt as a percentage of GDP: 18.5%
7. North Dakota
- Total state & local government debt per capita: $12,725
- Total state & local government debt: $9,697,010,000
- Total state government debt: $3,375,270,000
- Total local government debt: $6,321,740,000
- Total state & local government debt as a percentage of GDP: 17.0%

6. California
- Total state & local government debt per capita: $12,823
- Total state & local government debt: $506,660,567,000
- Total state government debt: $145,292,660,000
- Total local government debt: $361,367,923,000
- Total state & local government debt as a percentage of GDP: 16.2%

5. Alaska
- Total state & local government debt per capita: $12,994
- Total state & local government debt: $9,505,582,000
- Total state government debt: $6,060,930,000
- Total local government debt: $3,444,652,000
- Total state & local government debt as a percentage of GDP: 17.5%

4. Illinois
- Total state & local government debt per capita: $13,029
- Total state & local government debt: $165,097,105,000
- Total state government debt: $65,272,156,000
- Total local government debt: $99,824,941,000
- Total state & local government debt as a percentage of GDP: 18.6%

3. Massachusetts
- Total state & local government debt per capita: $14,263
- Total state & local government debt: $98,310,530,000
- Total state government debt: $78,663,118,000
- Total local government debt: $19,647,413,000
- Total state & local government debt as a percentage of GDP: 16.5%
TRENDING
Technical analysis and charting can help traders make decisions about which positions to take. Some CFD brokers offer more complex analysis features or more robust charting than others.

2. Connecticut
- Total state & local government debt per capita: $15,037
- Total state & local government debt: $53,612,594,000
- Total state government debt: $41,822,350,000
- Total local government debt: $11,790,243,000
- Total state & local government debt as a percentage of GDP: 18.6%

1. New York
- Total state & local government debt per capita: $18,411
- Total state & local government debt: $358,150,378,000
- Total state government debt: $150,744,533,000
- Total local government debt: $207,405,857,000
- Total state & local government debt as a percentage of GDP: 20.2%
Detailed Findings & Methodology
The states with the most state and local government debt per capita are spread across the country, including both very populous states such as California and Texas as well as sparsely populated Alaska. With over $18,000 in state and local government debt per resident, New York ranks first in per capita debt.
Local debt in New York is over $50 billion more than state government debt, due in large part to high amounts of school district debt. Nationally, state and local government debt totals $3.17 trillion, with local government debt making up 63% of the total.
The state and local debt to state GDP ratio shows how much a state owes compared to how much it produces. States with less debt as a percentage of state GDP are in a better position to repay their debts. As a percentage of state GDP, state and local government debt ranges from a low of 4.9% in Wyoming to a high of 24.7% in Kentucky.
To find the states with the most state and local government debt, researchers at Commodity.com analyzed the latest data from the U.S. Census Bureau’s 2019 Annual Survey of State and Local Government Finances and the Bureau of Economic Analysis’s Gross Domestic Product by State for 2019.
The researchers ranked states according to the total amount of state and local government debt per capita. Researchers also calculated total state and local government debt, total state government debt, total local government debt, and total state and local government debt as a percentage of state GDP.
Total state and local government debt is calculated as the sum of total long-term debt outstanding and short-term debt at the end of the fiscal year (debt payable one year or less from its date of issue).
!function(e,i,n,s){var t=”InfogramEmbeds”,d=e.getElementsByTagName(“script”)[0];if(window[t]&&window[t].initialized)window[t].process&&window[t].process();else if(!e.getElementById(n)){var o=e.createElement(“script”);o.async=1,o.id=n,o.src=”https://e.infogram.com/js/dist/embed-loader-min.js”,d.parentNode.insertBefore(o,d)}}(document,0,”infogram-async”);Update history
This page was revised 8 times between September 2021 and October 2021.
Replaced commodity trading guidance with broker feature comparisons and reorganized related content sections.
Replaced commodity trading guidance with broker selection information across multiple sections, removing natural gas and oil references.
Restructured sidebar labels by relocating "DID YOU KNOW?" and "TRENDING" tags to different content blocks and refined phrasing in the New York welfare reference.
Reorganized content labels by moving "DID YOU KNOW?" from Massachusetts to New Jersey section and "TRENDING" in reverse, plus refined wording in related content sentence.
Added contextual reference linking New York's debt ranking to its welfare spending patterns.
Added contextual cross-reference linking New York's debt ranking to its welfare spending and federal aid dependency.
Added 14 photo credits throughout the article and streamlined the introduction by removing a redundant sentence.
Added photo credits for 13 state sections and streamlined introductory paragraph by removing redundant content.
The Commodity Briefing
The stories behind the prices. Surprising, useful, occasionally weird - in your inbox every weekday.
- Price moves
- Supply shocks
- Macro drivers
Before you go
Get The Commodity Briefing - free, 2 minutes.