This page provides an explanation of the triangular moving average indicator in technical analysis.
Contents
What Is the Triangular Moving Average
The triangular moving average is a simple moving average that has been averaged again (i.e. averaging the average). This creates an extra smooth moving average line.
Triangular Moving Average Example Chart
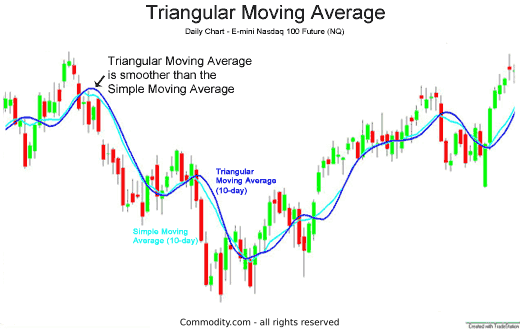
This chart of the E-mini Nasdaq 100 futures contract shows the relation between a 10-day simple moving average and a 10-day triangular moving average.

Generally, simple moving averages are smooth, but the re-averaging makes the triangular moving average even smoother and more wavelike.
Potential buy and sell signals for the triangular moving average indicator are discussed on the simple moving average indicator page.
Where to Trade Commodities Using Technical Analysis
If you’re interested in trading using technical analysis indicators like the triangular moving average, have a look at our reviews of these regulated brokers available in .
CFDs are complex instruments and come with a high risk of losing money rapidly due to leverage. Between 74%-89% of retail investor accounts lose money when trading CFDs. You should consider whether you can afford to take the high risk of losing your money.
Further Reading
For information on the other moving average indicators, you can check out the following pages:
- Adaptive Moving Average
- Exponential Moving Average (EMA)
- Simple Moving Average
- Typical Price Moving Average (Pivot Point)
- Weighted Moving Average (WMA)
Learn more about other technical analysis indicators, concepts, and strategies, including:
For all the basics on how to trade commodities, see our introduction to commodity trading.
Also, see our guides on forex, crypto, and options brokers to find out which technical charting tools online brokerages offer their clients.
FAQs
Here are some answers to frequently asked questions about moving averages.
Is moving average a good indicator?
Moving averages are the most common technical analysis indicator and very popular among traders to inform their trading strategies. The moving average is used as a technical analysis tool to smooth out prices by eliminating the impact of random, short-term fluctuations.
Traders rely on moving averages as a lagging – or trend-following – indicator because they are based on past prices.
Which moving average is best?
Determining which moving average is best depends on what you’re trading and whether you’re following short- or long-term trends. The two most popular moving averages are the simple moving average (SMA) and the exponential moving average (EMA).
Day-traders generally stick to EMAs for more and earlier signals. But while the SMA moves less and slower it also gives less wrong signals during periods of price volatility.


