In this guide to understanding the Price Channels Indicator, we’ll show you what this chart looks like, explain its components, and teach you how to interpret it.
Contents
What Is a Price Channels Indicator?
Price Channels suggest possible buy and sell signals based on price breakouts.
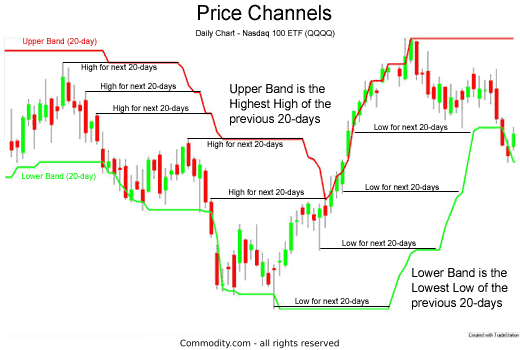
- Upper Price Channel: The highest high over a user-defined time period.
- Lower Price Channel: The lowest low over a user-defined time period.
The user-defined time period is generally 20 periods.
What Does the Price Channels Indicator Look Like?
To illustrate how a price channel is, let’s look at a chart of the Nasdaq 100 ETF (QQQQ) as shown in Chart 1:

How to Interpret Price Channels
Price Channels are primarily used to identify price breakouts.
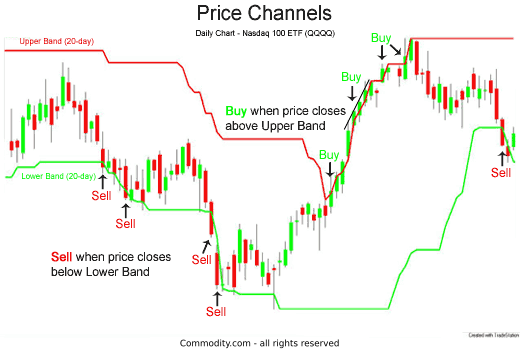
The possible buy and sell signals are shown below Chart 2 of the QQQQ’s:

Price Channel Potential Buy Signal
A trader might buy when the price closes above upper bands.
This is similar to a trader buying a breakout above resistance, where the resistance is equal to the highest high of the past 20 trading days.
Price Channel Potential Sell Signal
A trader might sell when price closes below lower bands.
This is like selling a breakout below support, but the support is equal to the lowest low of the previous 20 trading days.
Regulated Brokers: Where Can I Trade Commodities?
Start your research with reviews of these regulated brokers available in .
CFDs are complex instruments and come with a high risk of losing money rapidly due to leverage. Between 74%-89% of retail investor accounts lose money when trading CFDs. You should consider whether you can afford to take the high risk of losing your money.
FAQ
Below we answer some common questions about Linear Regression Line indicators.
What is a channel?
A channel is created by two parallel trendlines that mark the upper and lower bounds of an asset’s price over time. The upper line tracks the highest highs and the lower line tracks the lowest lows, as shown in Chart 1 above. The angle of the channel can add significance to the price movement, whether upward, downward, or parallel to the time series across the bottom of the price chart.
Further Reading
Learn more about technical analysis indicators, concepts, and strategies including:


