Read on to learn what the Mass Index is used for in trading as a technical analysis tool.
Contents
We cover how the mass index shows potential price reversals and how the two key components of the tool give this insight to traders.
What Is The Mass Index In Trading?
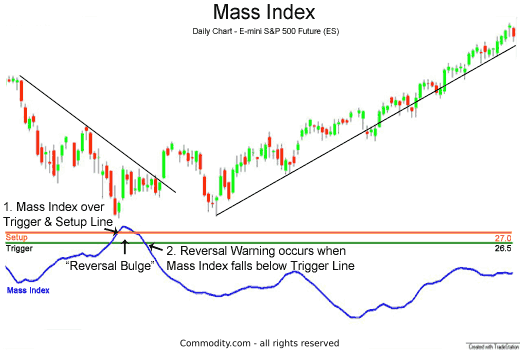
The Mass Index is used to warn of a future price reversal.
The theory behind the Mass Index is that reversals occur when the price range [high – low] increases (i.e. more volatility).

What Are The Components Of A Mass Index?
The components for a Mass Index reversal of trend, “Reversal Bulge” as the creator of the Mass Index, Donald Dorsey refers to it, are listed below:
- Mass Index rises above the trigger line (set at 26.5) and the setup line (set at 27).
- Mass Index then falls below the setup line. When the Mass Index falls below the trigger line, then a reversal of the prior trend is expected.
The Mass Index is presented as a useful technical tool that traders might use to time entry into bottoming markets.
Where Can I Trade And Use The Mass Index?
If you are interested in trading using technical analysis, have a look at our reviews of these regulated brokers in to learn which tools they offer:
CFDs are complex instruments and come with a high risk of losing money rapidly due to leverage. Between 74%-89% of retail investor accounts lose money when trading CFDs. You should consider whether you can afford to take the high risk of losing your money.
Further Reading
If you’d like to learn about other technical analysis tools, see our guides on:
- Herrick Payoff Index
- Directional Movement Index
- Commodity Channel Index
- Commodity Select Index
- Swing Index
- Stochastic RSI
- Ulcer Index
More, you can learn about different instruments to trade with like CFDs, Options, Stocks, Cryptocurrencies, and Forex from our range of broker guides.
FAQs
What does the Mass Index tool measure in trading?
The Mass Index is a technical analysis tool measures significant differences between selected price highs and lows in a trading chart. The mass index is used to project potential price reversals based on price ranges that have expanded far beyond average. These expanding price ranges indicate a likelihood of price contraction.
Is the Mass Index an accurate measure of volatility?
The Mass Index can be useful to measure potential volatility by observing previous price ranges and projecting the averages to future potential price points on the chart. For example, if the price range of the Dow Jones futures is approaching the widest price range it’s even shown within a given time period, there is a higher likelihood of decreasing volatility thereafter.


