The Herrick Payoff Index is a technical analysis tool.
In this guide, we cover what it shows traders, what factors it takes into account, and how you can read it on a chart.
Contents
What Is The Herrick Payoff Index?
The Herrick Payoff Index uses volume, open interest, and price to signal bullish and bearish divergences in the price of a future or options contract.
The use of open interest in the calculation of the HPI means the indicator can only be used with futures and options.
Types Of Open Interest
The HPI is based on two premises regarding open interest:
- Rising Open Interest: When prices rise and open interest rises, this is a bullish and confirming sign of recent price rises. Likewise, when prices fall and open interest rises, this is a bearish and confirming sign of recent falling prices.
- Falling Open Interest: When prices rise and open interest falls, this is considered to be a bearish sign and signal of an impending reversal. Similarly, when prices fall and open interest falls, this is considered to be a bullish sign and is a potential reversal signal.
How To Read The HPI Index
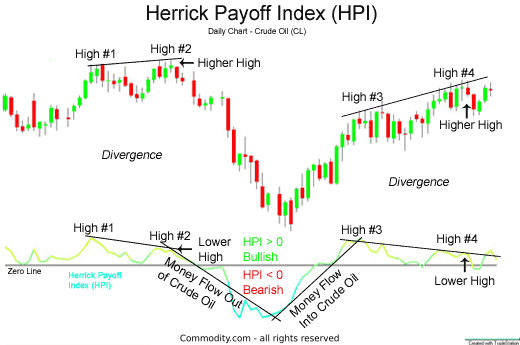
Here’s an example chart and how you can read the various components of this chart when you perform technical analysis with the HPI index.

Reading High #1 to High On The Chart
Crude oil made higher highs, yet the Herrick Payoff Index (HPI) made a lower low, which is a bearish divergence.
The logic behind the HPI indicator is that there was much trader excitement in crude oil at High #1, characterized by increasing volume and open interest.
Even though crude oil prices made a higher high at High #2, volume and open interest changes did not match those price increases on the second high.
What Does The Retreat Below Zero Show?
The HPI indicator then retreated below the zero line, the bearish price action in crude oil was confirmed. Traders might look for short sell opportunities.
The HPI indicator then bottomed out and reversed course, soon advancing above the zero line. The zero line crossover confirmed the bullish price action. Traders might be advised to look for buying opportunities.
Reading High #3 to High #4: What Do They Show?
In yet another bearish divergence, crude oil prices made new highs, yet the HPI indicator failed to confirm the price action, making a lower high.
This divergence acted as a warning of a potential price reversal.
The Herrick Payoff Index is an excellent technical analysis tool using volume and open interest to find potential price movement and warn of potential reversals.
Where Can I Trade With The HPI Index?
If you are interested in trading using technical analysis, have a look at our reviews of these regulated brokers available in and learn which analysis tools they offer:
CFDs are complex instruments and come with a high risk of losing money rapidly due to leverage. Between 74%-89% of retail investor accounts lose money when trading CFDs. You should consider whether you can afford to take the high risk of losing your money.
Further Reading
If you’re interested in learning about more applicable technical analysis indicators, see our guides on:
- VIX / VXN Volatility Indexes
- Mass Index
- Directional Movement Index
- Commodity Channel Index
- Commodity Select Index
- Stochastic RSI
- Swing Index
- Ulcer Index
Alternatively, see our trading guides on different ways to trade like CFDs, options, stocks, cryptocurrencies, and forex.


