In this guide to understanding the Time Series Forecast, we’ll show you what this chart looks like and teach you how to interpret it.
Contents
What Is the Time Series Forecast?
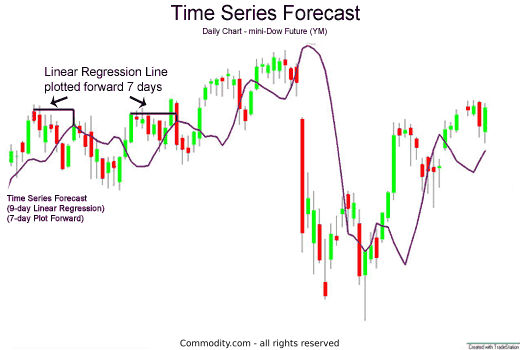
The Time Series Forecast uses Linear Regression to calculate a best-fit line over a designated time period. This line is then plotted forward for a user-defined time period.
What Does the Time Series Forecast Look Like?
The chart below of the mini-Dow Futures contract shows the Time Series Forecast indicator plotted forward for 7 days:

How to Interpret the Time Series Forecast
Generally, traders might expect price to return back to the Time Series Forecast line when prices have strayed.
Therefore, a vague potential buy signal could occur when price is below the line and a potential sell signal could occur when price is far above the line.
However, how far price needs to vary from the line is very subjective.
A similar, and arguably superior technical indicator, is the Linear Regression Curve.
Where Can I Trade?
Start your research with reviews of these regulated brokers available in , many have demo accounts so you can try technical trading tools yourself.
CFDs are complex instruments and come with a high risk of losing money rapidly due to leverage. Between 74%-89% of retail investor accounts lose money when trading CFDs. You should consider whether you can afford to take the high risk of losing your money.
You may also want to check out our guides to crypto brokers and forex brokers.
FAQ
Below we answer some common questions about Time Series Forecast indicators.
What is the difference between time series forecasting and regression analysis?
The main difference between these two analysis types is that time series is extrapolation and regression is interpolation. A time series forecasts takes previous data points and uses a mathematical model to predict future events. A regression analysis attempts to explain mathematically what happened between two or more data points. Regression can then attempt to predict future data points based on that model.
Further Reading
Learn more about technical analysis indicators, concepts, and strategies including:


