We discuss what the McClellan Oscillator shows traders as a technical analysis tool and which components make up the data.
Contents
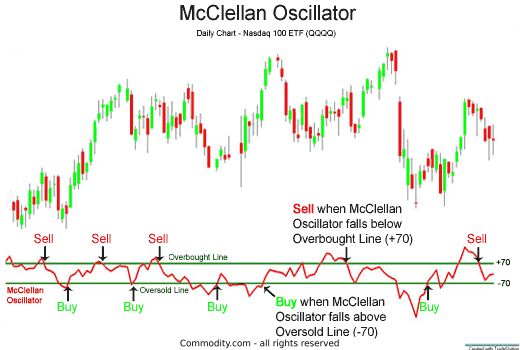
Read on to see a chart example of how you can read the McClellan Oscillator on a chart where the oscillator falls above or below the overbought or oversold line.
What Is The McClellan Oscillator?
The McClellan Oscillator uses advancing issues and declining issues on the New York Stock Exchange (NYSE) to gauge market breadth.
The components are:
- Advancing Issues – Declining Issues
- Calculate both the 19 & 39-day exponential moving average (EMA) of [Advancing Issues – Declining Issues]
- Plot the result of the 19-day EMA minus the 39-day EMA
How To Read The McClellan Oscillator
Just like the MACD, when the short-term moving average crosses above the longer-term moving average, the plotted line crosses the zero line.

Therefore, when the McClellan Oscillator crosses above zero, the trend of the advance-decline issues is positive, giving us a bullish sign.
In contrast, when the McClellan Oscillator crosses below zero, the trend of the advance-decline issues is negative, showing a bearish sign.
Buy And Sell Signals With The McClellan
Generally, above +70 is considered an overbought condition, and below -70 is an oversold condition.
A trader might consider a buy signal when the McClellan Oscillator crosses above the -70 oversold line.
Similarly, a trader might consider a sell signal when the McClellan Oscillator crosses below the +70 overbought line.
Where Can I Test The McClellan Oscillator?
If you are interested in trading stocks and commodities using technical analysis, have a look at our reviews of these regulated brokers available in to learn which charting & analysis features they offer:
CFDs are complex instruments and come with a high risk of losing money rapidly due to leverage. Between 74%-89% of retail investor accounts lose money when trading CFDs. You should consider whether you can afford to take the high risk of losing your money.
Further Reading
Learn more about technical analysis indicators, concepts, and strategies including Support & Resistance, Moving Averages, Fibonacci Patterns, and many others.
Also see our guides on Forex, Bitcoin, CFD, Stocks, Cryptos, and Options brokers to find out which technical analysis tools and platforms popular online trading brokerages offer their clients.
FAQs
What does the McClellan Oscillator show?
Similarly to the market thrust index or ‘breadth thrust’ index, the McClellan Oscillator shows the breadth of a chart. That said, the McClellan is used to indicate the constantly changing difference between the number of advancing issues and declining issues. It can also be used to detect divergence in a chart.


