Williams %R is an overbought and oversold technical indicator that may offer potential buy and sell signals. Williams %R is very similar to the Stochastic Fast indicator (see: Stochastics) as the chart below will illustrate:

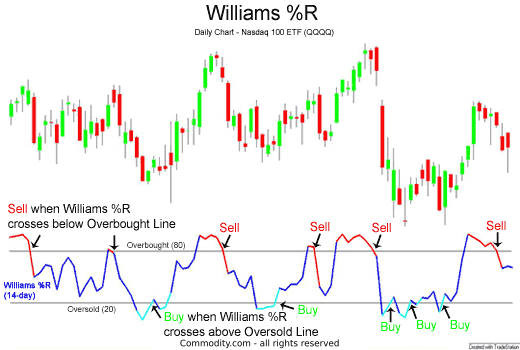
Like Stochastics, the Williams %R indicator attempts to give buy and sell signals, as is demonstrated in the chart below of the Nasdaq 100 exchange-traded fund QQQQ:

Contents
Williams %R Potential Buy Signal
When the Williams %R indicator is below the oversold line (20) and it rises to cross over the 20 line, then a trader might buy.
Williams %R Potential Sell Signal
A trader might sell when the Williams %R indicator is above the overbought line (80) and then falls below the 80 line.
Furthermore, the Williams %R indicator may help identify strong trends; this is discussed on the next page.
Williams %R and Trends
Since the Williams % R indicator is similar to stochastics, it might be useful during sideways, non-trending markets. However, during trends, the Williams % R probably does not fare as well.
Nevertheless, the Williams % R indicator can give tell tale signs of strong trends. The following chart of the Nasdaq 100 ETF (QQQQ) illustrates Williams % R’s ability to detect such trends:

As the chart of the QQQQ illustrate, when the Williams % R indicator stays in the oversold area (below 20) and any bullish rally barely registers with the Williams %R (i.e. fails to go above 80), then the downtrend appears to be strong and a trader might avoid any potential buy signals.
Similarly, when the Williams %R indicator stays in the overbought area (above 80) and any attempt at a downturn fails to send the indicator into oversold territory (i.e. fails to go below 20), then the uptrend appears to be strong and a trader might avoid going short.
The Stochastic indicator (see: Stochastics) would be a logical next step for investigation.
How to Get Started Trading
If you are interested in trading, have a look at our reviews of these regulated brokers available in to learn which charting tools they offer:
CFDs are complex instruments and come with a high risk of losing money rapidly due to leverage. Between 74%-89% of retail investor accounts lose money when trading CFDs. You should consider whether you can afford to take the high risk of losing your money.
Further Reading
Learn more about technical analysis indicators, charting concepts and strategies including Triple Exponential Average (TRIX), Fibonacci Time Extensions, and the McClellan Oscillator.
Also see our guide to understanding the basics of reading candlestick charts and option trading strategies.


