Did you know that Germany is the top exporter of cars, while the US is the top importer? Curious about which metals are even more rare and valuable than gold?
Read on to find out, and discover additional (properly sourced) facts, statistics and trivia we found interesting, and think our readers might, too.
Contents
Trading & Investment Statistics
If you bought 10 Amazon shares for $180 in 1997, they’d be worth more than $230,000 today – One Amazon share cost $18 in the company’s initial public offering (IPO). Investors who held on to their shares have three stock splits between 1997 and 1999 to thank for their good fortune. Source: Statista
$5 Trillion+ in Currencies Is Traded Each Day – According to Nasdaq, as of 2019, more than $5 Trillion is traded on currency exchanges every day. By volume, this is the largest market, in the world. Source: Nasdaq
The World Bank launched the first-ever pandemic bonds in 2017 – The specialized bonds are aimed at supporting the Pandemic Emergency Financing Facility (PEF) with more than $500 million to cover developing countries against the risk of pandemic outbreaks. This was the first time that low-income countries’ pandemic risk was transferred to financial markets. Source: World Bank
The New York Stock Exchange (NYSE) is the world’s largest stock exchange operator – In April 2020, the market capitalization of NYSE listed companies amounted to $25 trillion. This was more than the combined market caps of the next three biggest stock exchanges, namely Nasdaq, London Stock Exchange, and Tokyo Stock Exchange. Source: Statista
George Soros “broke the bank of England” in 1992 – The legendary trader made over $1 billion in a single day by betting the British pound was priced too richly against the strong Deutschmark. In the process, he brought the Bank of England to its knees. Source: Money Morning
Long-term finances are a major cause of stress for millennials – According to the Deloitte Global Millennial Survey 2020 of 27,500 millennials and Gen Zs, both generations were worried about their financial future. However, more than half of millennials and almost half of Gen Zs are saving money to deal with unexpected expenses. Source: Deloitte
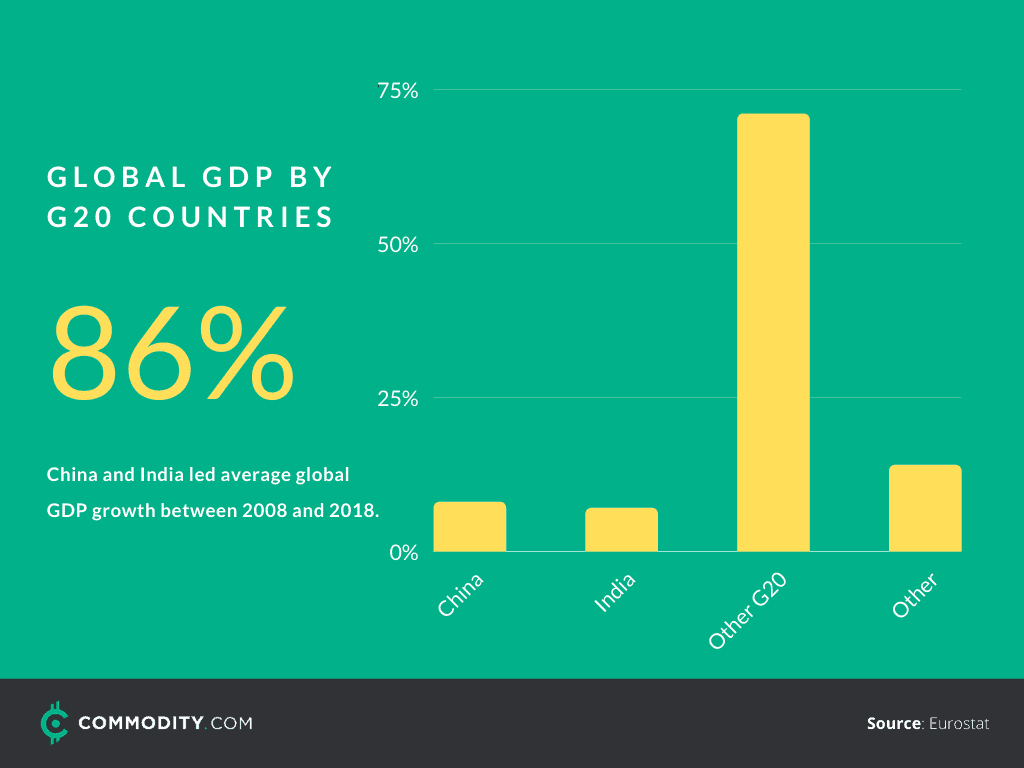
The G20 accounted for 86% of the global GDP in 2018 – G20 members China and India had the highest GDP growth between 2008 and 2018. The G20 is made up of 19 individual countries and the EU. Source: Eurostat
The US housing market crash caused a sharp rise in wealth inequality – Between 2007 and 2010, the period affected by the crash, the median net worth of households declined from $118,600 to $66,500. Mean net worth, which is skewed to high net worth households, only dropped 16% (from $620,500 to $521,000). By 2016, the median net worth had only improved slightly to $78,100 while the mean net worth surpassed its 2007 value to reach $667,600. Source: National Bureau of Economic Research
Cars are consistently one of the world’s top traded products – With a total trade of $782 billion, cars were the 2nd most traded product in 2018. Germany is the top exporter and the US the top importer of cars. Trade-in cars represent 4.25% of total world trade. Source: OEC
Jim Rogers predicted the financial crisis of 2008 – No later than early 2007, Jim Rogers predicted that the subprime real estate market would crash and that the shock would spread throughout the world. Source: Reuters
Machinery and equipment was the most exported product from the EU between 2015 and 2019 – The top 5 EU export products in 2019 were machinery and equipment (13%), motor vehicles (11.3 %), pharmaceutical products (9.6 %), chemical products (8.3 %) and computer, electronic and optical products (8.1 %). Germany was the biggest exporter of all 5 top products. Source: Eurostat
Financial analysts with a bachelor’s degree earn an average annual salary of $85,660 – According to the US Bureau of Labor Statistics, this was the median pay of financial analysts in 2018. Employment within the field is expected to increase by 6% between 2018 and 2028, which is as fast as average. Most financial analysts work more than 40 hours per week. Source: BLS
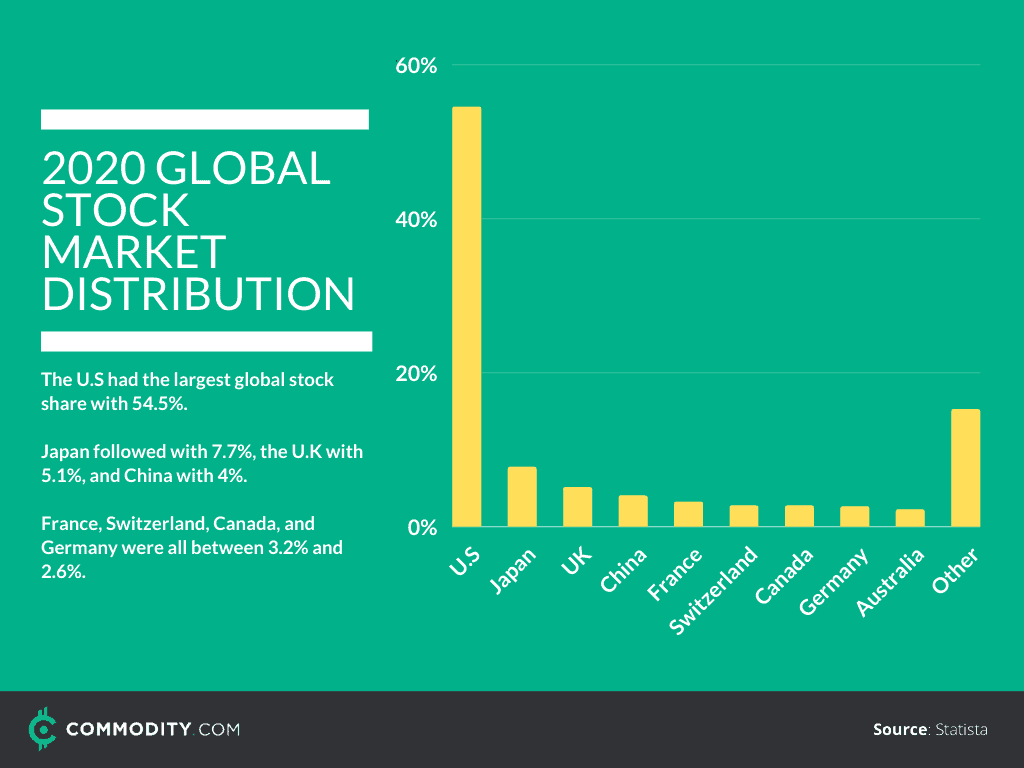
United States stock markets accounted for over 54% of world stocks in 2020 – The countries with the second and third largest stock markets are Japan and the United Kingdom. Within the US, the New York Stock Exchange, and the NASDAQ are the biggest stock exchange operators. Source: Statista
The Dow Jones Industrial Average (DJIA) was named after its founder, Charles Dow – The “Dow” as it is often called, is one of the best-known market indices in the world, and the second-largest in the US. Charles Dow, who founded it in 1885, was an editor of The Wall Street Journal. Source: Statista
Poor performance by the Indian cricket team has a negative effect on the country’s stock market – In a 2010-study, researchers from Australia’s Monash University found there was a significant downward movement in India’s stock market when the national cricket team lost a One Day International match. A win had no substantial impact on the market. Source: Science Direct
American families trust investment companies with around 21% of their financial assets – Around 44.8% of American households owned mutual funds in 2018. The total number of mutual funds in the US that year was 9,599. They managed assets to the value of $17.71 trillion. Bond funds constituted 22% of the market share. Source: Statista
Snowfall can be traded as a futures contract or option – Snowfall contracts are offered by the Chicago Mercantile Exchange (CME) on locations such as New York’s Central Park and Baltimore Washington International Airport. They enable market participants affected by snowfall to transfer their inherent risk, while traders have the opportunity to profit from the unpredictability of the weather. Source: CME
Algorithmic Trading & AI
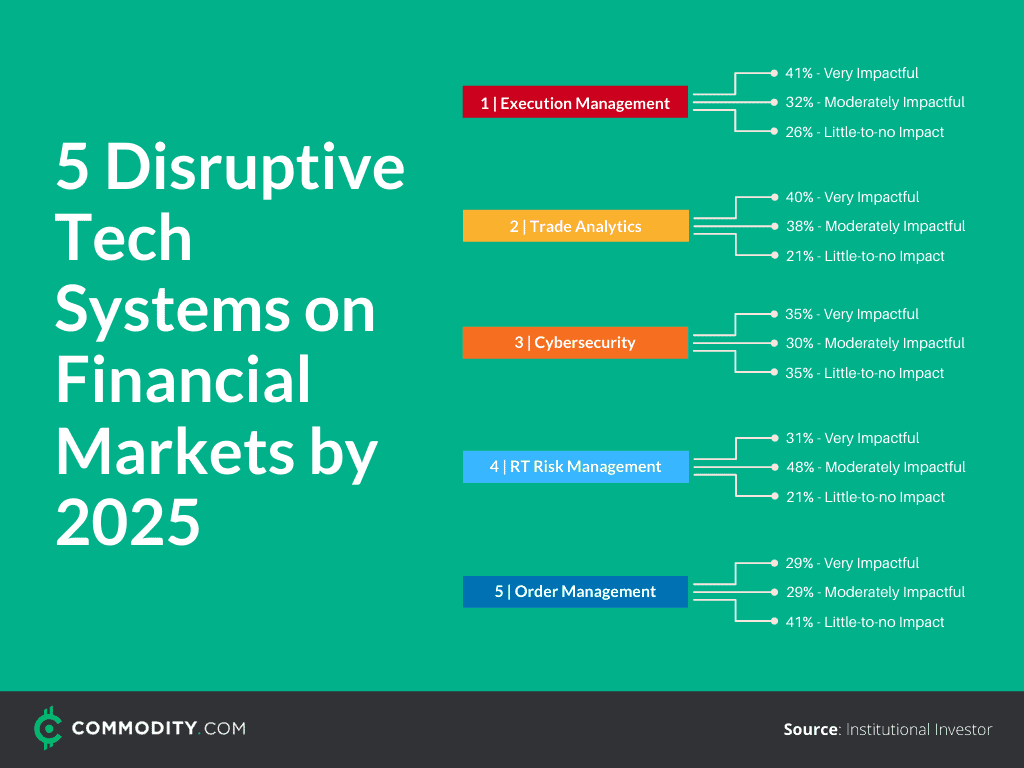
Over 40% of capital market professionals are using artificial intelligence – According to a 2019-study called The Future of Trading: Technology in 2024, 4 of 5 participants expected AI/machine learning to be fully integrated into the trading process by 2024. Only 44% were using it at the time of the study, while 17% said they planned to use it within two years. Source: Institutional Investor
A faulty trading algorithm cost one company $440 million in 2012 – Defective code in an untested program led to the Knight Capital Group’s computers to buy and sell millions of shares in just 45 minutes. Huge losses were encountered due to the high frequency of trades. Source: The Economics Review
Artificial intelligence is estimated to contribute $15.7 trillion to the global economy by 2030 – Research by PwC showed that consumer demand stimulated by product enhancements through AI will contribute 45% of total economic gains. This will mean a boost of 26% and 14.5% to the Chinese and North American GDPs respectively. Source: PwC
AI has the potential to improve international trade negotiations outcomes – Brazil has established an Intelligent Tech & Trade Initiative which includes AI to improve trade negotiations. AI can potentially analyze the economic trajectories of negotiating partners and predict the trade response from non-participating countries. Source: Brookings
Algorithmic trading removes human emotion from trades – According to Nasdaq, this is a big advantage of algorithmic trading. Human traders may make irrational decisions influenced by their emotions, especially fear and greed. Algo trading forces trades to take place within a predetermined set of criteria. Source: Nasdaq
Currency and Money Statistics
Queen Elizabeth II holds the Guinness World Record for appearing on the most currencies – At least 35 countries have released coinage featuring the face of the British monarch during her reign of almost 70 years. They include Canada, South Africa, Jamaica, Hong Kong, and Cyprus. Source: Guinness World Records
Cocaine has been found on 90% of US bills – Of the 234 bills collected by researchers across the US in 2009, nearly 90% were tainted with measurable levels of cocaine. In comparison, bills from China and Japan had low levels of cocaine contamination. Source: National Geographic
The British pound or pound sterling is the oldest currency in continuous use – The first pound-value coin called a sovereign was minted in 1489 under King Henry VII. Hand-written banknotes only began to circulate in 1694. Source: BBC
King Croesus of Lydia developed a monetary system with different denominations in the 6th century BC – The Lydians, living in present-day Turkey, were among the first people to use coins for trading. While the earliest coins were made from electrum, Croesus minted money from gold and silver. Source: Money Museum
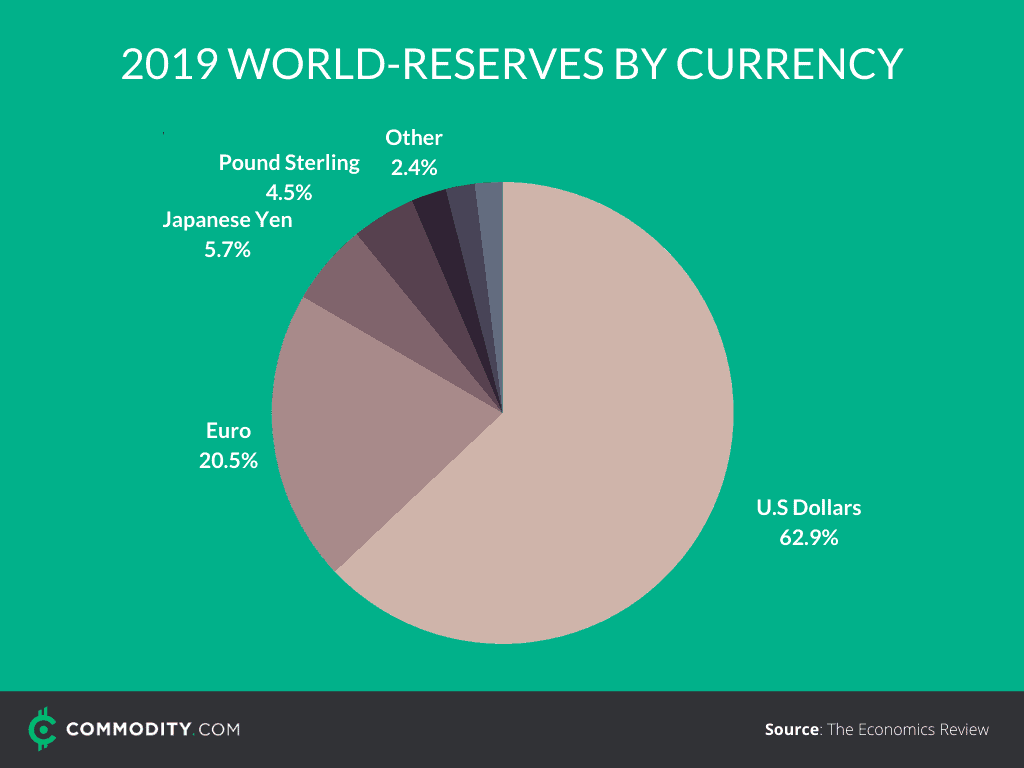
The US dollar has been the world’s reserve currency for more than 80 years – Most currencies were backed by gold in the early 20th century and the US had the most gold reserves. In 1933, the US effectively went off the gold standard – two years after the major European powers. Today, 65% of all dollars in circulation are used outside of the US. Source: The Economics Review
Covid-19 may be the beginning of the end of paper currency – The pandemic placed a renewed emphasis on paper currency as a source of infectious agents. This is after an earlier study showed that 90% of US banknotes contained bacterial colonization. Contactless payments are now being promoted as an alternative to cash. Source: Washington Post
Fiat (paper) currency has led to more credit and more unstable markets – According to Deutsche Bank Markets Research, the decline of precious metals (coinage) currency systems from the 1970s introduced an era of budget deficits, loose monetary policy, global imbalances, and rising debts. Source: Deutsche Bank
Bitcoin and Cryptocurrencies
The near quarter trillion-dollar market capitalization of all cryptocurrencies shows it’s potential in becoming a leading marketplace to speculate on. Major cryptocurrencies like Bitcoin, Ethereum, and Ripple are popular among traders, but altcoins like Monero, NEO, and Verge also receive attention.
The true identity of Bitcoin’s creator is unknown – The name Satoshi Nakamoto is only a pseudonym used by the real Bitcoin creator. The written framework for Bitcoin was released in 2008 by a person or entity operating under this name. Source: Statista
More than 1,000 cryptocurrencies have failed – The list of dead coins, the name for cryptocurrencies which have been abandoned or failed, totaled 1,085 by 2019. Source: The Conversation
Bitcoin is the most expensive cryptocurrency – One coin was valued at $9,784 in June 2020. Maker was the 2nd most expensive virtual currency, valued at $691. Source: Statista
The top 10 cryptocurrencies have a market capitalization of almost a quarter trillion dollars – Bitcoin represents 72.8% of this total with Ethereum at 11.4%. The remaining 8 currencies total 15.8%. Source: CoinMarketCap
Crypto art puzzles became the new hot thing in the art world in 2014 – Marguerite deCourcelle created the “Dark Wallet Puzzle,” a painting with 3.4 Bitcoin coded into the work. A later painting in a series named The Legend of Satoshi Nakamoto contained a Bitcoin riddle worth $50,000 when it was solved in 2018. Source: Bloomberg
$11.5 billion worth of cryptocurrency transactions in 2019 was associated with criminal activity – While this represents only 1.1% of total activity, millions of people were scammed to the value of $8.6 billion. A large proportion were victims of only two large-scale Ponzi schemes. Source: Chainalysis
The Commodity Futures Trading Commission may prosecute fraud in the crypto space – During a 2018 judgment, a federal judge ruled that virtual currencies are commodities and can be regulated as such by the CFTC. Source: CFTC
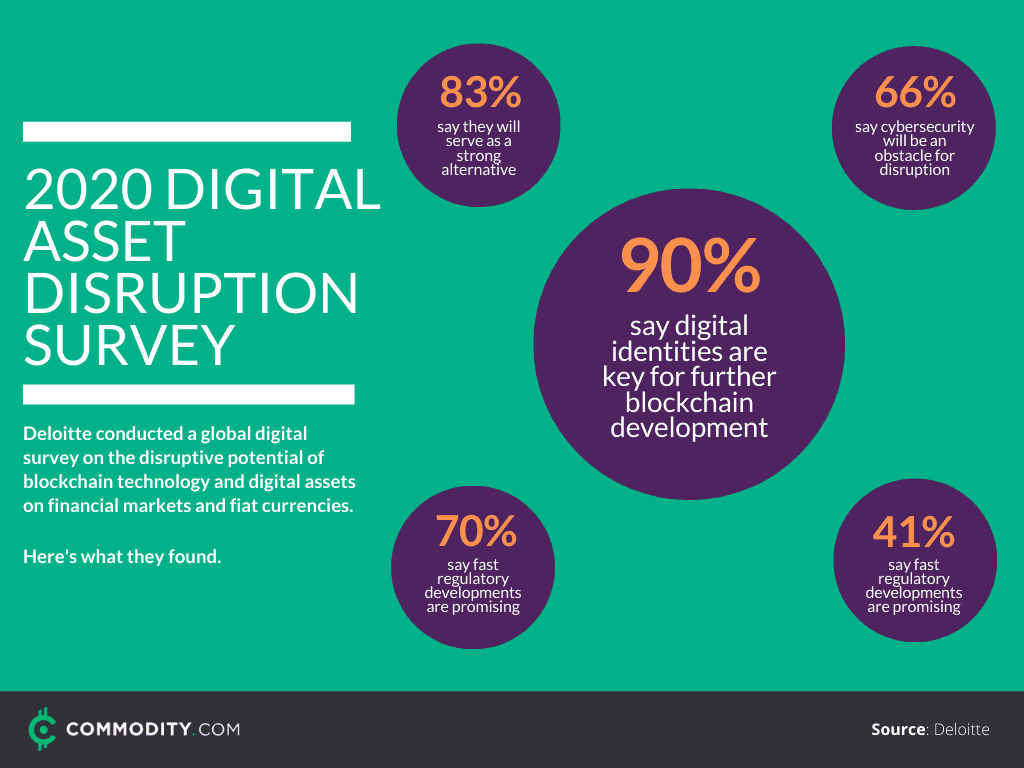
Digital assets can replace, or be a strong alternative to, fiat currency by 2030 – This was the view of 83% of respondents in Deloitte’s 2020 Global Blockchain Survey. Cybersecurity concerns were the biggest obstacle to the widespread acceptance and use of digital assets, according to 66% of respondents. Source: Deloitte
Bitcoin has been described as the new gold – Researchers from the University of Pretoria tested claims that the cryptocurrency has joined the ranks of safe-haven assets like gold. Although not everyone agreed with them, they believe their findings confirmed that bitcoin is a hedge against uncertain times. Source: Forbes
Commodity Statistics
Between 2012 and 2050, it is estimated that agricultural demand will increase by at least 5%. Here are some other interesting statistics and facts about commodities and commodity trading.
The Chicago Board of Trade (CBOT) created the world’s first futures exchange in 1848 – The CBOT went on to develop the first octagonal futures trading pit in 1970. The CBOT later merged with the Chicago Mercantile Exchange (CME), who became the first US exchange to go public in 2002. Source: CME Group
The global Covid-19 pandemic led to declines in most commodity prices – The UNCTAD’s Free Market Commodity Price Index (FMCPI) lost 20.4 % of its value in March 2020. Driven by steep drops in oil prices, this represented the highest fall in the history of the FMCPI. Before that, the maximum month-on-month decrease was 18.6% during the global financial crisis of 2008. Source: UNSTATS
Covid-19 may lead to permanent changes in the demand and supply of commodities – An analysis by the World Bank found that, along with the unprecedented collapse in oil demand, supply chain disruptions may have a negative effect on the production and consumption of other commodities. Source: World Bank
UK exports to the Commonwealth were worth £65.2 billion in 2019 – UK Trade with Australia, Canada, India, Singapore, and South Africa accounted for 71% of exports to Commonwealth countries. Source: House of Commons Library
Global exports reached a record high of $19.5 trillion in 2018 – This number represented an increase of 9.7% compared to 2017. Developing and transition economies contributed $9.3 trillion to the total, while $10.1 trillion came from developed countries. Source: UNCTAD
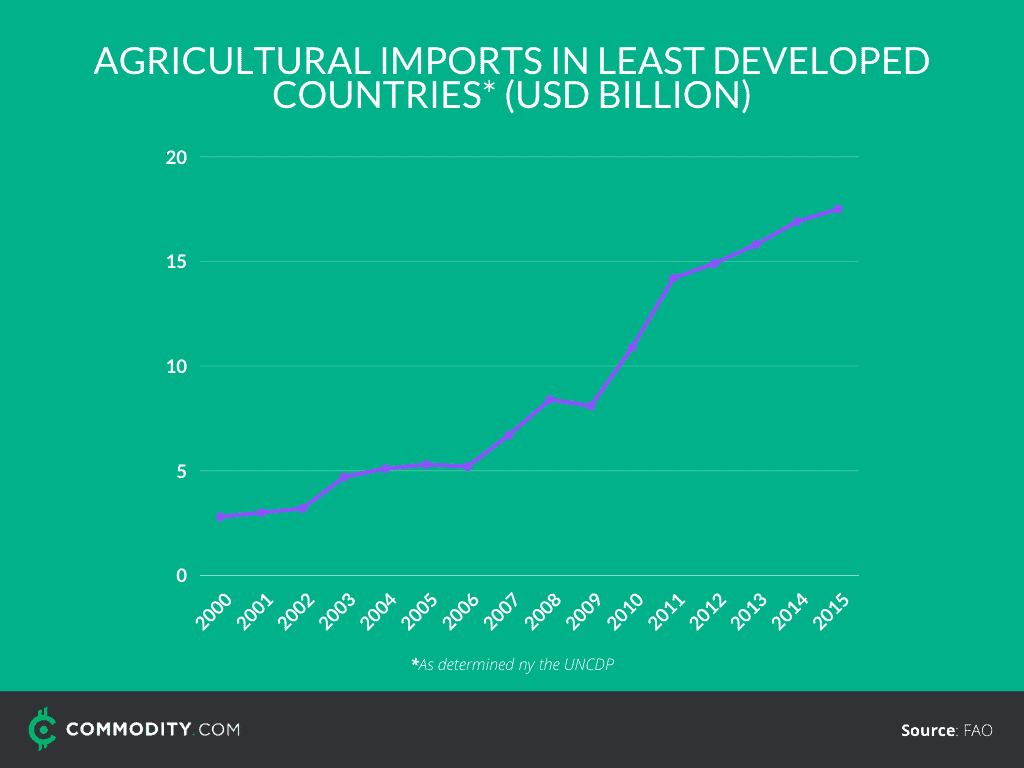
The value of agricultural trade increased more than threefold between 2000 and 2016 – To meet growing demand, agriculture will need to produce 50% more food, feed, and biofuel in 2050 than in 2012. Climate change is likely to have a significant effect on the price of agricultural commodities. Source: FAO
World Electricity Generation is likely to reach 45 trillion kWh by 2050 – This is more than double the 2018 level of 20 trillion kWh. In the period leading to 2050, global electric power generation from renewable sources is estimated to increase by more than 20%, while coal-fired generation will decrease by 13%. Source: EIA.gov
Green technologies have the potential to define the commodity marketplace of the future – Low-carbon technology requirements are expected to increase the demand for metals and minerals such as copper, aluminum, lithium, silver, zinc, and steel. Source: World Bank
Oil & Gas Statistics
Oil is the world’s most traded commodity. We’ve gathered other interesting stats and facts about oil, gas, and other energy commodities.
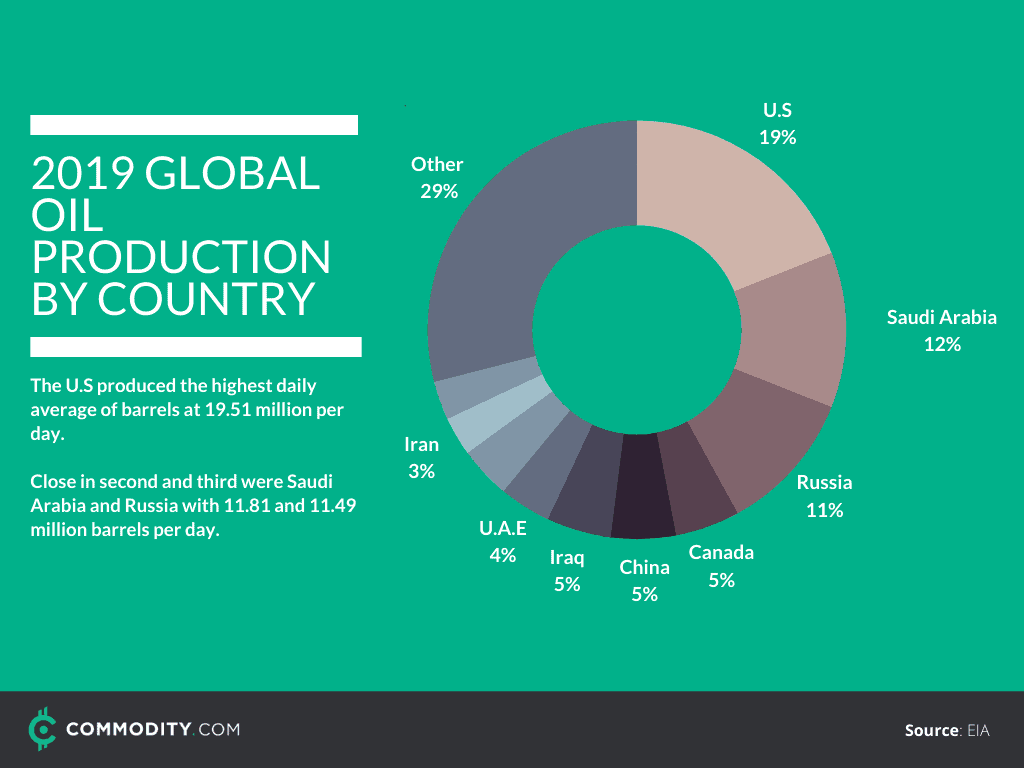
10 oil-producing countries are responsible for 70%+ of world production – The top-10 countries are: USA (19%), Saudia Arabia (12%), Russia (11%), Canada (5%), China (5%), Iraq (5%), UAE (4%), Brazil (4%), Iran (3%), and Kuwait (3%). In 2019, the top-10 countries produced over 71% of all the world’s oil. The top-5 countries produced 53%. Source: EIA.gov
Edward L Drake drilled the world’s first oil well in 1856 near Titusville, Pennsylvania – The well produced between 20-40 barrels per day, which soon filled all the whiskey barrels in Titusville. Western Pennsylvania continued to produce half of the world’s oil until 1901 when the East Texas oil boom happened. Source: Pennsylvania Center for the Book
Natural gas and petroleum product consumption in Asia is rising faster than supply is growing – This trend has the potential to shift trade patterns and infrastructure investments. The demand in Asia is expected to increase by 22% between 2018 and 2050 while crude oil supply is expected to increase by only 21%. Source: EIA.gov
There are 165.4 million barrels of proven bitumen reserves in Alberta, Canada – This makes it the world’s third-largest oil reserves, after Venezuela and Saudi Arabia. Source: Canadian Energy Research Institute
The second West-East Gas Pipeline, which is 8,819 km long, can deliver 30 billion cubic meters of gas per year – The pipeline, the world’s longest, runs from Xinjiang to Shanghai and Hong Kong. Once all four phases of the pipeline are completed, it will be more than 20,000 km long and capable of delivering 77 billion cubic meters annually. Source: CNPC
Gold, Silver, Precious Metals
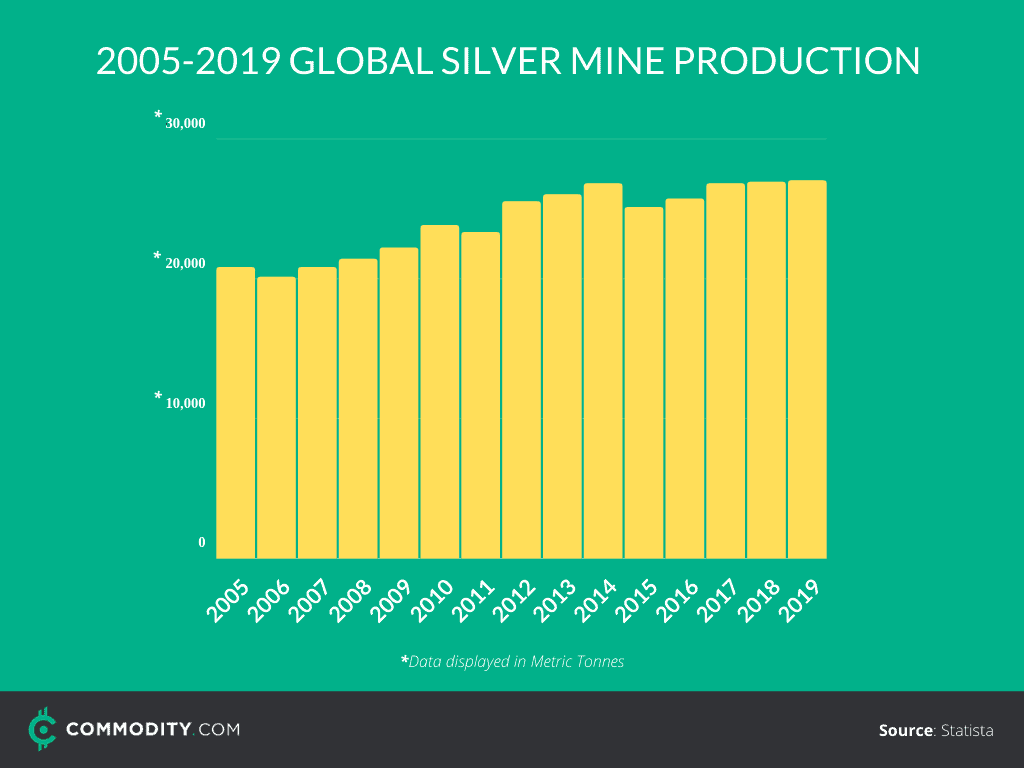
Global silver mine production has been consistently over 25,000 metric tonnes per year since 2017. Precious metals like gold, silver, palladium, and platinum are all in constant demand.
Gold and other heavy metals were formed by dense neutron star collisions – This is the theory of astronomers who studied a brief flash of gamma-rays which crossed the universe in June 2013. They concluded that the collision of neutron stars accounted for all heavy metals heavier than iron. These include gold, lead, and platinum. Source: Smithsonian Magazine
South Africa, Australia, and Russia have the largest estimated gold mine reserves – While estimates fluctuate, global gold mine reserves are not likely to exceed 50,000 metric tons. That’s why its value is primarily determined by rarity. Source: Statista
Tons of gold and silver were buried under the World Trade Center when the twin towers collapsed in 2001 – Roughly 379,036 ounces of gold and 29,942,619 ounces of silver were removed from basement vaults in the weeks after the September 11 attacks. The metals were stored by the Bank of Nova Scotia on behalf of people or companies who bought them as investments. Source: CNN
Silver is the most abundant and the most affordable precious metal – The 2020 price of silver was estimated to hover around $17 per ounce. Mexican company Fresnillo was the leading producer of silver in 2018. – Source: Statista
London vaults held a record high of 8,515 tons of gold at the end of March 2020 – This equated to around 681,239 gold bars worth $440.5 billion. At the same time, a record high of 36,570 tons of silver worth $16.4 billion were kept in the London vaults. Source: LBMA
Palladium is the most expensive of the major precious metals – Used in large quantities in catalytic converters in the automotive industry, the demand for palladium is expected to be steady although an increased production of battery-electric vehicles may cause it to rise. Source: Mining Technology
The International Monetary Fund (IMF) holds nearly 3 metric tons or 90.5 million ounces of gold – Kept in different designated depositories, the IMF’s gold holdings were worth $137.8 billion at the end of 2019. Source: IMF
Gold’s key role in the international monetary system ended in 1973 – This was when the Bretton Woods system of monetary management, which fixed exchange rates, finally dissolved. It meant members of the IMF could no longer peg their currency to gold but only to other currencies. Source: IMF
Most Americans choose gold over Bitcoin as an investment – More than 80% of the 1,500 respondents in a 2019-survey said they’d take $10,000 worth of gold instead of Bitcoin if they had to keep it for 10 years. Younger people were more inclined to choose Bitcoin, with nearly 25% of 25 to 34-year olds saying they’d prefer the cryptocurrency. Source: PR Newswire
Annual gold production has tripled each year since the early 1970s – During the same period, gold purchases have quadrupled annually. Different uses for the precious metal (jewelry, technology, investment) explains why it’s been a popular investment asset for so long. Source: World Gold Council
The US consistently has the largest gold reserves in their central bank holdings – This amounted to more than 8,000 metric tons of gold in March 2020. While China had less gold on reserve, it was the world’s biggest gold producer. Source: Statista
COVID-19 lead to an increase in gold investment demand but a decrease in consumer demand – According to the World Gold Council’s Global Demands Trend report, investment demand increased by 80% in the first quarter of 2020. Holdings of gold-backed ETFs were particularly high, reaching a record of 3,185 tons. Source: World Gold Council
The deepest gold mine in the world is almost 4 km below the surface – South Africa’s Mponeng mine, belonging to AngloGold Ashanti, may still reach a depth of 4.22 km as current operations continue. With around 36 million tons of gold reserves, Mponeng is expected to be in operation until 2027. Source: NS Energy
Summary
The world of investing is full of surprising facts and figures. Staying informed is key to making the right investment decisions.
Statistics and figures are constantly changing, but we hope our interesting facts and stories provide a useful and entertaining background about the investment landscape of the past and future.
Regulated Brokers: Where Can I Trade Commodities?
Start your research with reviews of these regulated brokers available in .
CFDs are complex instruments and come with a high risk of losing money rapidly due to leverage. Between 74%-89% of retail investor accounts lose money when trading CFDs. You should consider whether you can afford to take the high risk of losing your money.
Credits: Original research by Linda De Beer & Frank Moraes, additions by Marko Csokasi, Toni Allen, and other members of the Commodity.com editorial team.


