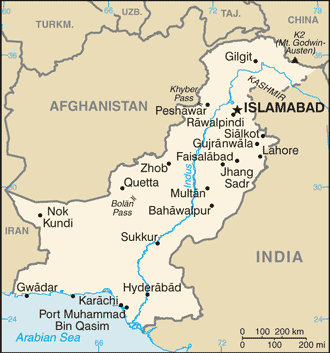
In this economic guide to Pakistan we’ll give you an overview of the Pakistani economy, including the country’s primary imports and exports of goods and services, as well as their primary destinations.
Contents
Economy of Pakistan – Overview
Pakistan is ranked as the 39th global economy per GDP measures.
The country exported products worth of $26.8 billion (69th of 222) and services worth $5.3 billion (41st of 88), That’s a total export volume of $32.1 billion.

Since Pakistan’s total import volume is $71.8 billion, the country has a negative trade balance of -$39.6 billion, although this is far from the only indicator of the nation’s economic standpoint.
Pakistan’s GDP
The following statistics give additional insight on how Pakistan stands at the 39th by GDP:
- GDP Growth: 85% (2008-2018)
- GDP Total: $315 billion
- GDP Per Capita: $1,482
By GDP per capita metrics, Pakistan is the 163rd economy in the world out of 196 countries
Pakistan’s Top 5 Commodity Exports
The top five commodity exports of Pakistan are:
- Rice – $1.98 billion
- Heavy Pure Woven Cotton – $989 million
- Light Pure Woven Cotton – $712 million
- Raw Sugar – $587 million
- Refined Petroleum – $484 million
Other Notable Exports
- House Linens – $3.5 billion
- Non-Knit Men’s Suits – $1.6 billion
- Non-Retail Pure Cotton Yarn – $1.3 billion
- Non-Knit Women’s Suits – $904 million
- Knit Sweaters – $765 million
Pakistan’ Top 5 Commodity Imports
Several of the following top five commodity imports overlap with Pakitan’s top exports:
- Refined Petroleum $5,756,078,945.58
- Crude Petroleum $4,157,542,325.57
- Petroleum Gas $3,284,077,284.80
- Palm Oil $1,978,214,892.96
- Scrap Iron $1,413,647,690.42
Other Notable Imports
- Coal Briquettes $1,383,802,367.85
- Raw Cotton $1,348,267,198.79
- Broadcasting Equipment $995,464,089.54
- Soybeans $888,168,485.21
- Mixed Mineral or Chemical Fertilizers $815,248,844.84
Details About Exports and Imports
Find out which product categories top the list of exported and imported products, along with where the produce comes from, and where it goes to.
Distribution by Product Categories
Pakistan’s most exported products by category are:
- Textiles – $14.7 billion
- Vegetable Products – $3.66 billion
- Foodstuffs – $1.56 billion
- Mineral Products – $1.31 billion
- Animal Hides – $1.05 billion
While the most imported products by category are:
- Mineral Products- $14.9 billion
- Machines – $10.8 billion
- Chemical Products – $7.06 billion
- Metals – $5.73 billion
- Textiles – $5.31 billion
Distribution by Destination Country & Origin
Most exports from Pakistan are sent to:
- United States – 13.2%
- China – 7.32%
- Germany – 6.68%
- Afghanistan – 6.26%
- United Kingdom – 6.07%
Meanwhile most imports originate from:
- China – 26.6%
- United Arab Emirates – 12.4%
- Saudi Arabia – 4.88%
- United States – 4.47%
- Indonesia – 4.02%
All figures based on OEC/IMF 2018 calculations and projections unless otherwise stated.
Where Can I Trade Commodities?
Start your research with reviews of these regulated brokers available in .
CFDs are complex instruments and come with a high risk of losing money rapidly due to leverage. Between 74%-89% of retail investor accounts lose money when trading CFDs. You should consider whether you can afford to take the high risk of losing your money.
Further Reading
- Guide to Commodity Brokers
- How to Choose a CFD Broker
- Guide to Trading Soft Agricultural Commodities
- Guide to Trading Sugar


