In this guide to understanding the Chaikin Oscillator (also called the Volume Accumulation Oscillator), we’ll show you what this chart looks like, how it’s similar to other indicators, and teach you how to interpret it with examples.
Contents
What Is the Chaikin Oscillator?
The Chaikin Oscillator or Volume Accumulation Oscillator consists of the difference between two exponential moving averages (usually 3-day and 10-day) of the Accumulation Distribution Line indicator and might be used to confirm price movement or divergences in price movement.
The main purpose of the Chaikin Oscillator is to attempt to confirm price trends and attempt to warn of impending price reversals.
Chaikin Compared to On Balance Volume
The Chaikin Oscillator is considered to be more accurate than the On Balance Volume indicator.
- On Balance Volume: adds all volume for the day if the close is positive, even if the stock closed only a penny higher; or subtracts all volume for the day if the stock closes lower.
- Chaikin Oscillator: factors in the closing price in relation to the highs, lows, and average price and determines the appropriate ratio of volume to be attributed to the day.
What Does the Chaikin Oscillator Look Like?
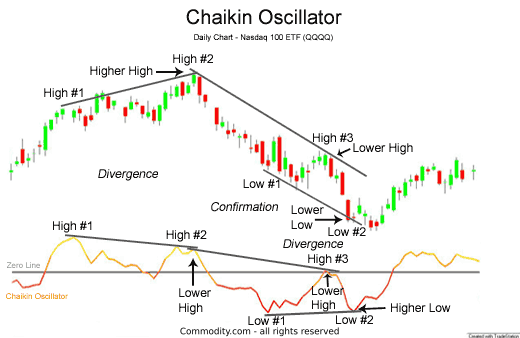
The chart below of the Nasdaq 100 ETF QQQQ illustrates these confirmation signals and divergence signals:

How to Interpret the Chaikin Oscillator
We use the chart above to give you examples of how to interpret the Chaikin Oscillator.
Example: High #1 to High #2
The Nasdaq 100 ETF QQQQ made higher highs, usually interpreted as a bullish sign. However, the Chaikin Oscillator failed to mirror the QQQQ’s advance higher and ended up making a lower low. This bearish divergence forewarned of the impending price reversal.
Example: High #2 to High #3
The QQQQ’s made a significantly lower high. The Chaikin Oscillator confirmed the QQQQ’s downtrend by making a lower high as well.
Example: Low #1 to Low #2
The Nasdaq 100 made significant lower lows, yet the Chaikin Oscillator made higher lows. This bullish divergence signaled that the previous downtrend may have ended.
Summary
The Chaikin Oscillator is a volume based technical indicator that attempts to confirm the current price action or foreshadow future price reversals.
Other technical indicators similar to the Chaikin Oscillator are the On Balance Volume indicator and the Money Flow Index.
FAQs
Here are answers to some popular questions about Chaikin Oscillators.
What is an oscillator?
An oscillator is a technical indicator chart that shows price changes over time between two bands. The bands are usually located above (higher prices) and below (lower prices) the center line of the chart, but they can also be set at specific levels. The purpose of an oscillator is to determine if an asset is overbought or oversold.
Who is the Chaikin Oscillator named for?
The Chaikin Oscillator is named for Marc Chaikin, founder and CEO of Chaikin Analytics, and a stock analyst since 1965. Other technical indicators created by Chaikin include the Accumulation Distribution Line (ADL), the Volume Accumulator (VAC), and the Money Flow Index (MFI).
Regulated Brokers: Where Can I Trade Commodities?
Start your research with reviews of these regulated brokers available in .
CFDs are complex instruments and come with a high risk of losing money rapidly due to leverage. Between 74%-89% of retail investor accounts lose money when trading CFDs. You should consider whether you can afford to take the high risk of losing your money.
Further Reading
Learn more about technical analysis indicators, concepts, and strategies including:


