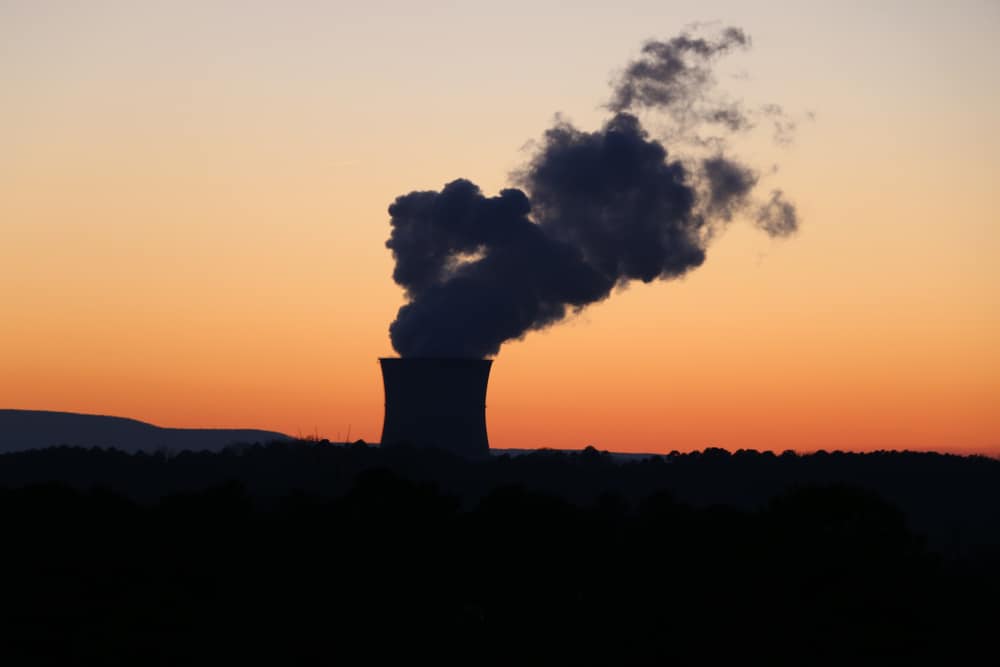
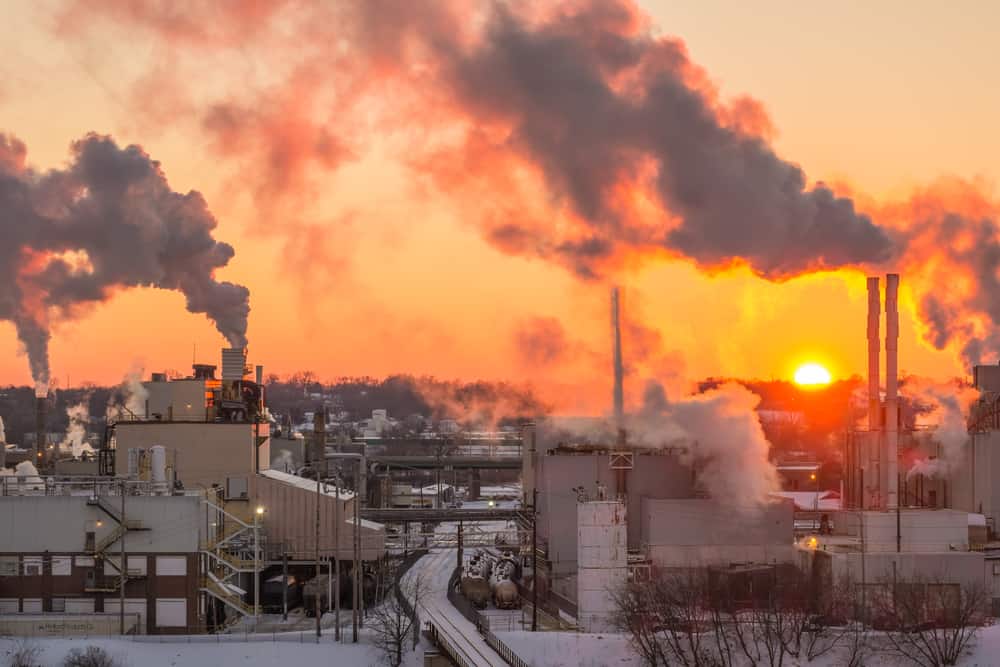
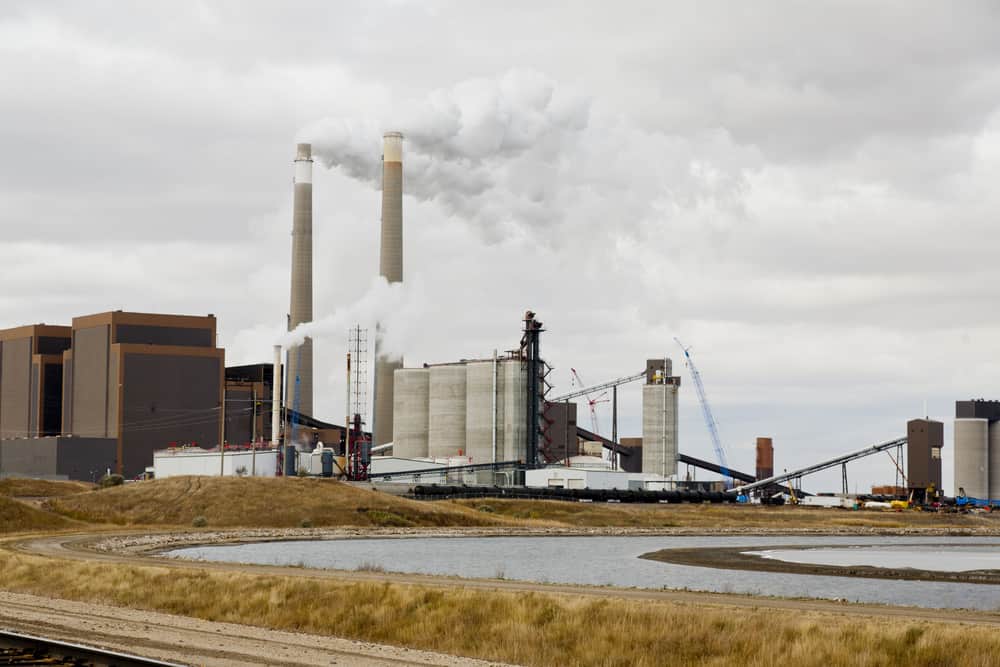
As the effects of climate change become more severe, policymakers worldwide are increasingly focused on how to limit greenhouse gas emissions, slow the pace of climate change, and mitigate climate risks.
World leaders met in Glasgow in November of last year for the latest United Nations climate conference, with the aim of setting new, more aggressive targets to reduce emissions and combat warming. The conference produced a number of pledges to accomplish this goal, including agreements to phase down the use of coal and fossil fuels for energy.
In the U.S., limiting carbon emissions has been a major goal in the first year of President Joe Biden’s administration.
A $1 trillion infrastructure bill passed by Congress and signed into law in November included major new investments in the electric grid and clean energy, electric vehicle charging stations, and enhanced rail and public transportation systems to reduce emissions.
The Biden Administration has also used other means to establish emissions reductions as a priority, including a broad pledge to cut the nation’s emissions by 2030 and an executive order outlining specific steps the federal government will take to reduce its carbon footprint from operations and procurement.
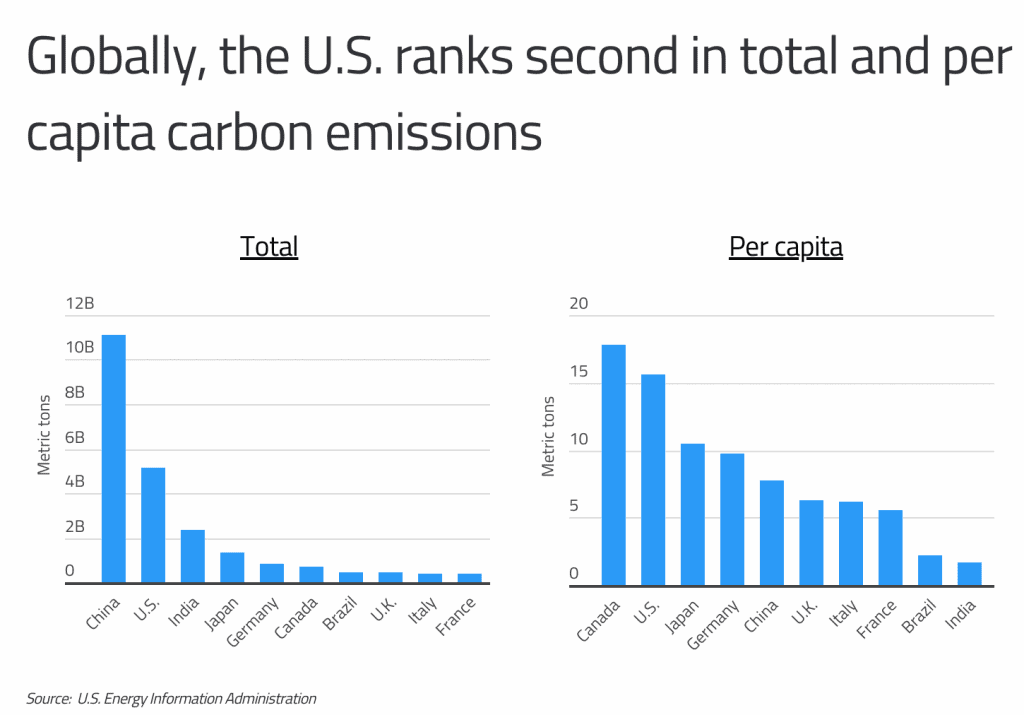
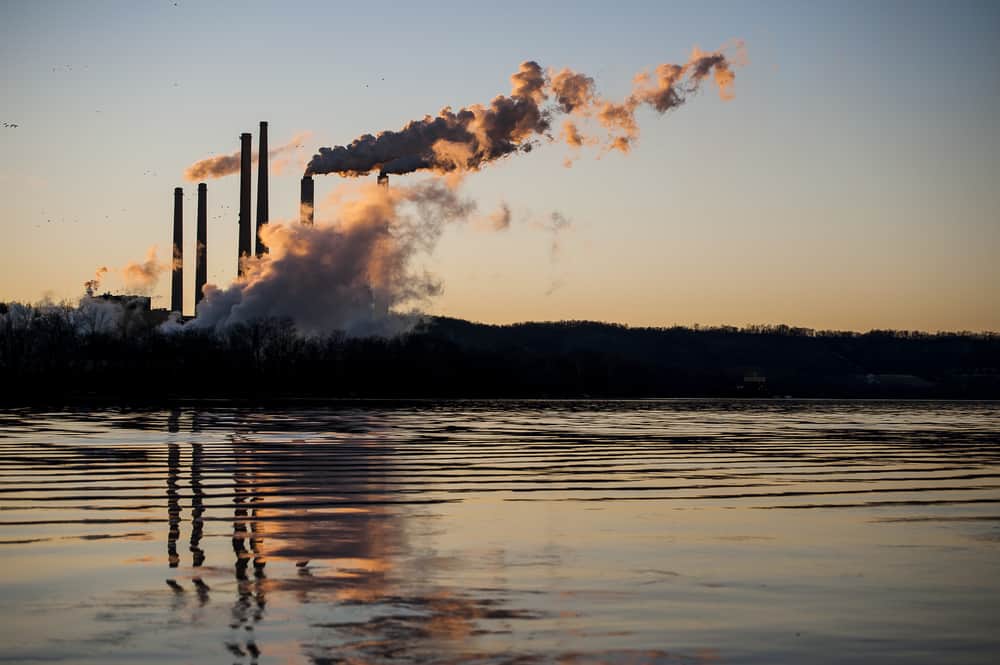
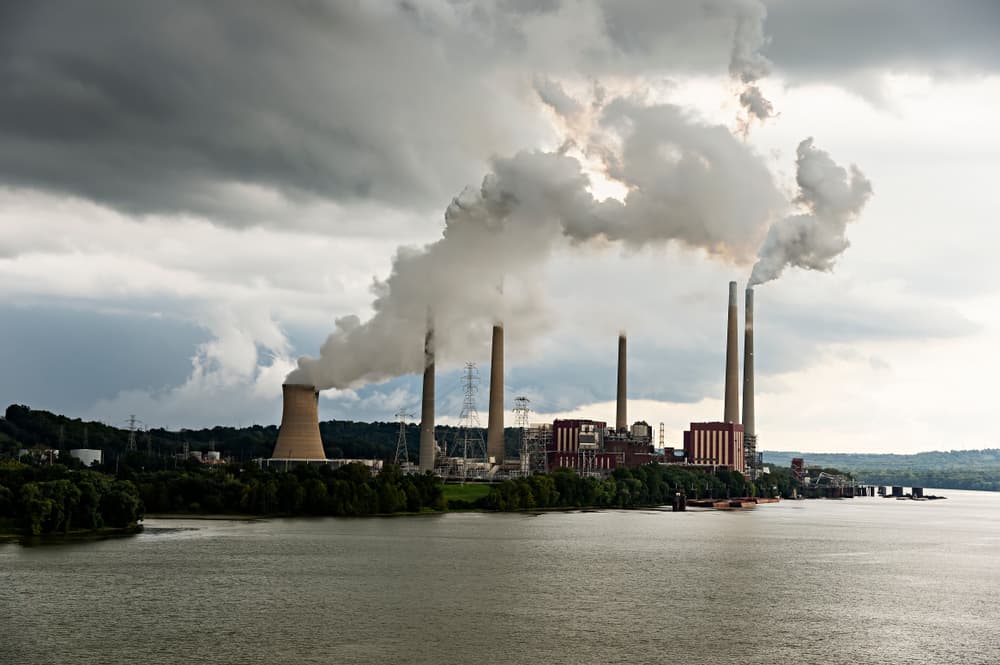
Strong U.S. action to reduce carbon emissions is critical to reducing emissions worldwide. As the world’s largest economy, the U.S. is one of the top producers of carbon emissions.
The U.S. generates 5.1 billion tons of CO2 in total each year, behind only China at 11.1 billion. The U.S. also ranks second in carbon emissions on a per capita basis, with emissions of 15.6 tons of CO2, trailing Canada’s 17.8 tons of CO2 per capita.
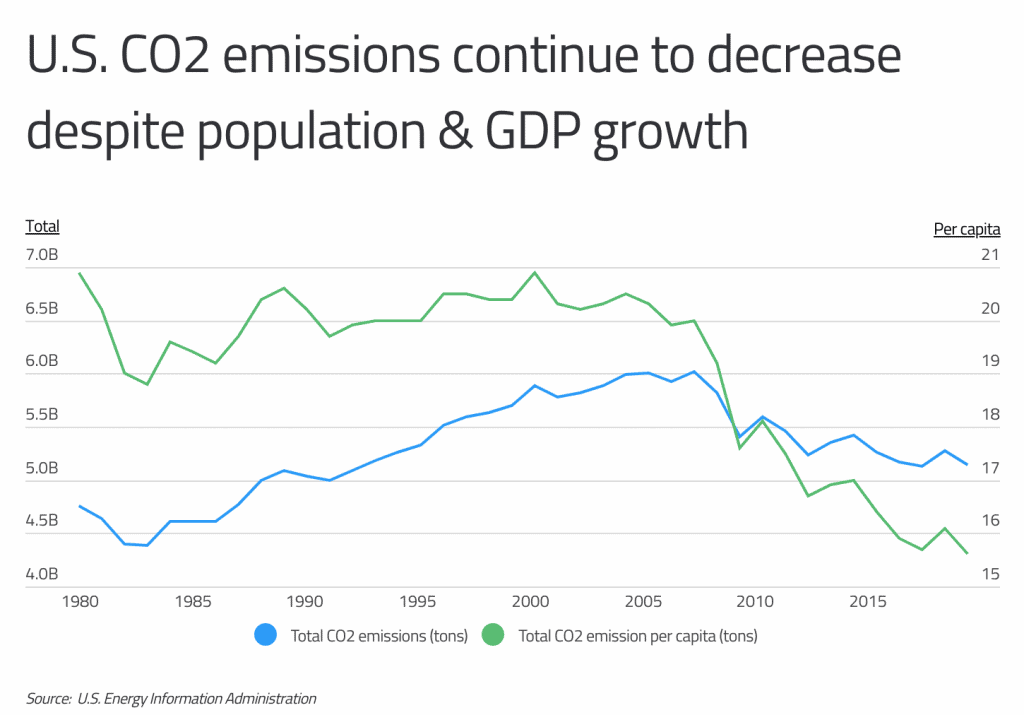
While the U.S. remains among the top emitters worldwide, CO2 emissions have been trending downward over time. Total CO2 emissions reached a peak of around 6 billion tons in 2007, but since then, annual emissions have declined by almost 1 billion tons per year.
Per capita emissions have shown a similar decline over the same period, even despite continued U.S. population and GDP growth over that period.
DID YOU KNOW?
Broker fee structures vary from broker to broker. Some charge deposit and withdrawal fees, while others don’t. Inactivity fees are also common, and different payment methods may be cheaper to use than others. Learn more about brokers in our guide to choosing commodity brokers.
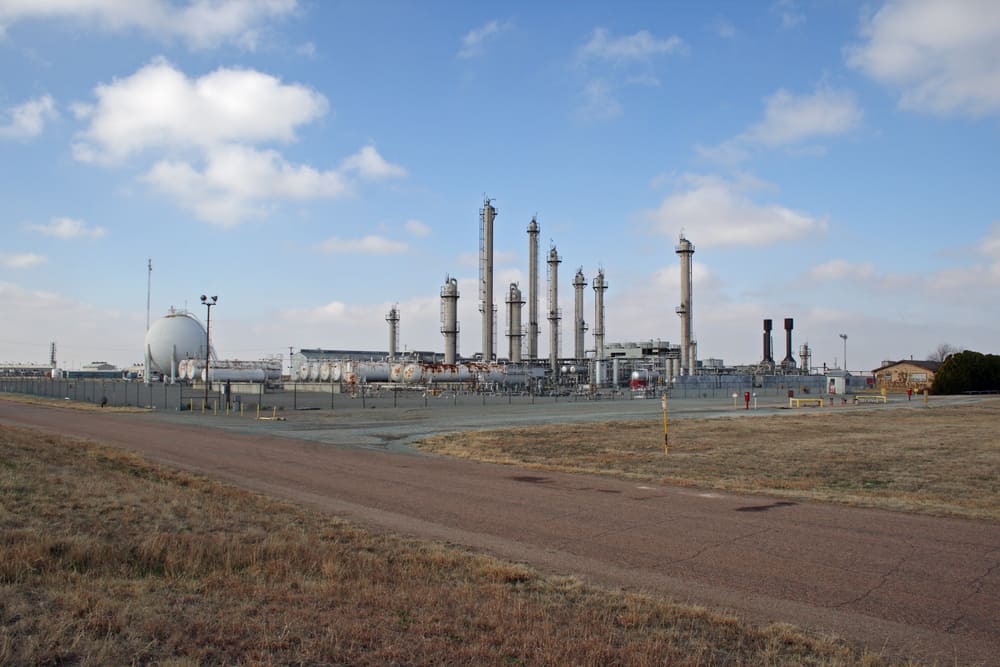
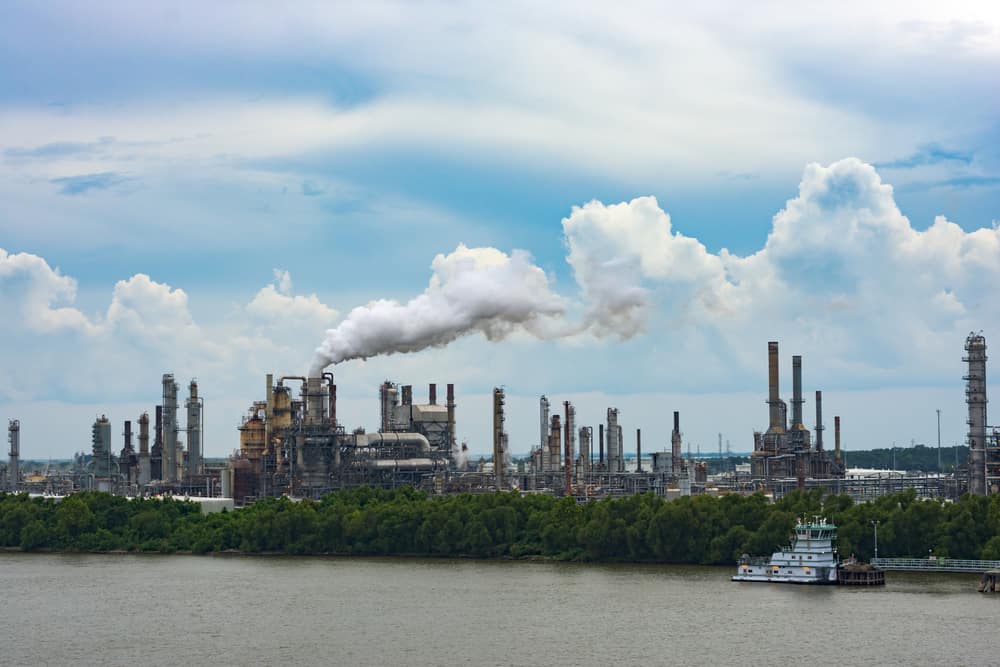
States in the U.S. contribute different amounts to these totals depending on factors like population, economic makeup, and government policy.
Larger states like Texas and California tend to have the highest emissions on an absolute basis, but in some states, this is mitigated at the per capita level by greater reliance on clean energy or policies like emissions targets.
In contrast, many of the top states for carbon emissions on a per capita basis have both low populations and economies that rely heavily on fossil fuels for energy or industrial purposes, including Wyoming, North Dakota, and West Virginia.
The data used in this analysis is from the U.S. Energy Information Administration and the U.S. Census Bureau. To determine the states with the largest carbon footprint, researchers at Commodity.com calculated per capita annual CO2 emissions. In the event of a tie, the state with the higher total annual CO2 emissions was ranked higher.
Here are the states with the most carbon dioxide emissions.
U.S. States With the Largest Carbon Footprint
15. New Mexico
- Per capita annual CO2 emissions (tons): 21.7
- Total annual CO2 emissions (tons): 45,400,000
- Sector that emits the most CO2: Electric Power
- Fuel that emits the most CO2: Petroleum
14. Alabama
- Per capita annual CO2 emissions (tons): 23.2
- Total annual CO2 emissions (tons): 113,300,000
- Sector that emits the most CO2: Electric Power
- Fuel that emits the most CO2: Natural Gas
RELATED
When the time period for a CFD expires, the trader reaps a profit or suffers a loss, depending on whether the price change they predicted comes true or not. Learn more about CFDs and CFD brokers, as well as the most popular alternatives to trading CFDs, in our detailed guide.
13. Arkansas
- Per capita annual CO2 emissions (tons): 23.6
- Total annual CO2 emissions (tons): 71,100,000
- Sector that emits the most CO2: Electric Power
- Fuel that emits the most CO2: Coal

12. Texas
- Per capita annual CO2 emissions (tons): 23.9
- Total annual CO2 emissions (tons): 684,000,000
- Sector that emits the most CO2: Industrial
- Fuel that emits the most CO2: Petroleum
11. Oklahoma
- Per capita annual CO2 emissions (tons): 24.8
- Total annual CO2 emissions (tons): 97,700,000
- Sector that emits the most CO2: Electric Power
- Fuel that emits the most CO2: Natural Gas
10. Iowa
- Per capita annual CO2 emissions (tons): 26.3
- Total annual CO2 emissions (tons): 82,800,000
- Sector that emits the most CO2: Electric Power
- Fuel that emits the most CO2: Coal
9. Kentucky
- Per capita annual CO2 emissions (tons): 27.1
- Total annual CO2 emissions (tons): 121,200,000
- Sector that emits the most CO2: Electric Power
- Fuel that emits the most CO2: Coal

8. Nebraska
- Per capita annual CO2 emissions (tons): 27.2
- Total annual CO2 emissions (tons): 52,500,000
- Sector that emits the most CO2: Electric Power
- Fuel that emits the most CO2: Coal
7. Indiana
- Per capita annual CO2 emissions (tons): 28.2
- Total annual CO2 emissions (tons): 188,800,000
- Sector that emits the most CO2: Electric Power
- Fuel that emits the most CO2: Coal

6. Montana
- Per capita annual CO2 emissions (tons): 29.0
- Total annual CO2 emissions (tons): 30,800,000
- Sector that emits the most CO2: Electric Power
- Fuel that emits the most CO2: Coal
5. Louisiana
- Per capita annual CO2 emissions (tons): 42.7
- Total annual CO2 emissions (tons): 199,300,000
- Sector that emits the most CO2: Industrial
- Fuel that emits the most CO2: Natural Gas
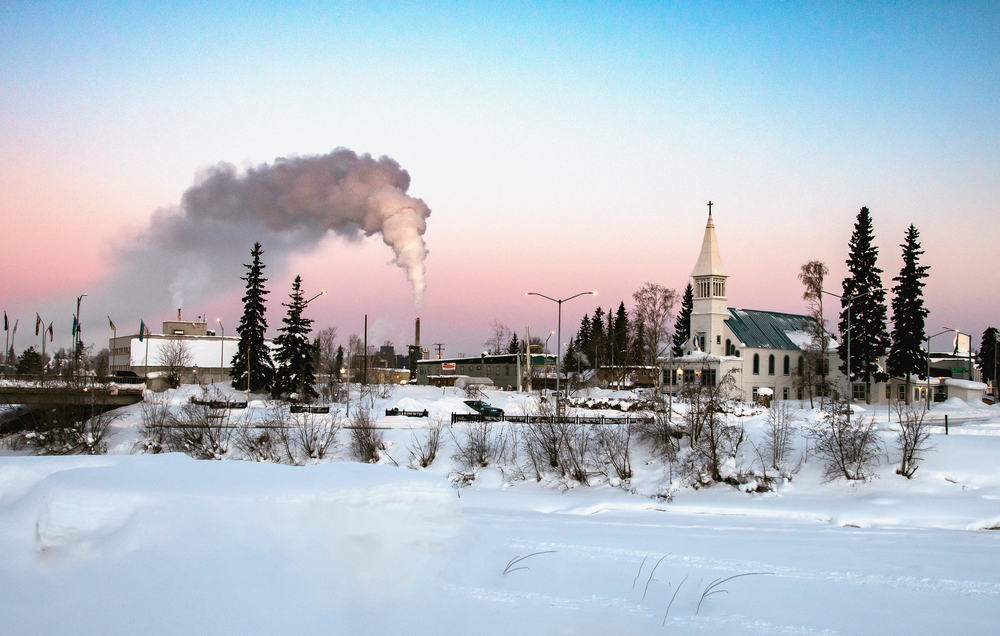
4. Alaska
- Per capita annual CO2 emissions (tons): 47.6
- Total annual CO2 emissions (tons): 35,100,000
- Sector that emits the most CO2: Industrial
- Fuel that emits the most CO2: Natural Gas
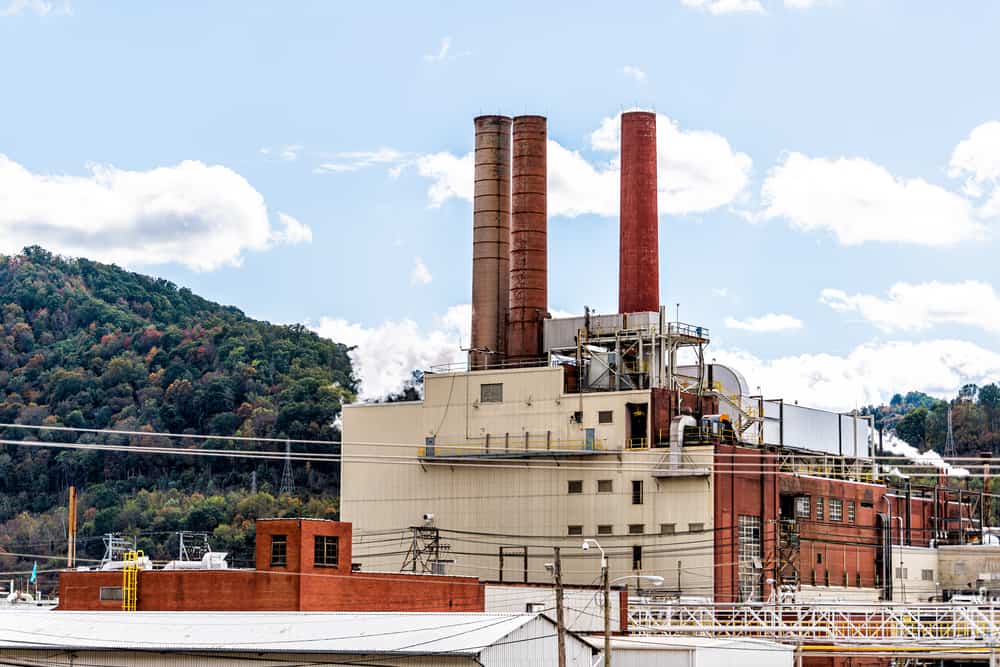
3. West Virginia
- Per capita annual CO2 emissions (tons): 49.8
- Total annual CO2 emissions (tons): 90,000,000
- Sector that emits the most CO2: Electric Power
- Fuel that emits the most CO2: Coal
TRENDING
Our Plus500 review covers the good and bad about the broker and its trading platform. You’ll also find all the information you need to open an account and start trading if Plus500 becomes available in the United States.
2. North Dakota
- Per capita annual CO2 emissions (tons): 77.7
- Total annual CO2 emissions (tons): 59,100,000
- Sector that emits the most CO2: Electric Power
- Fuel that emits the most CO2: Coal
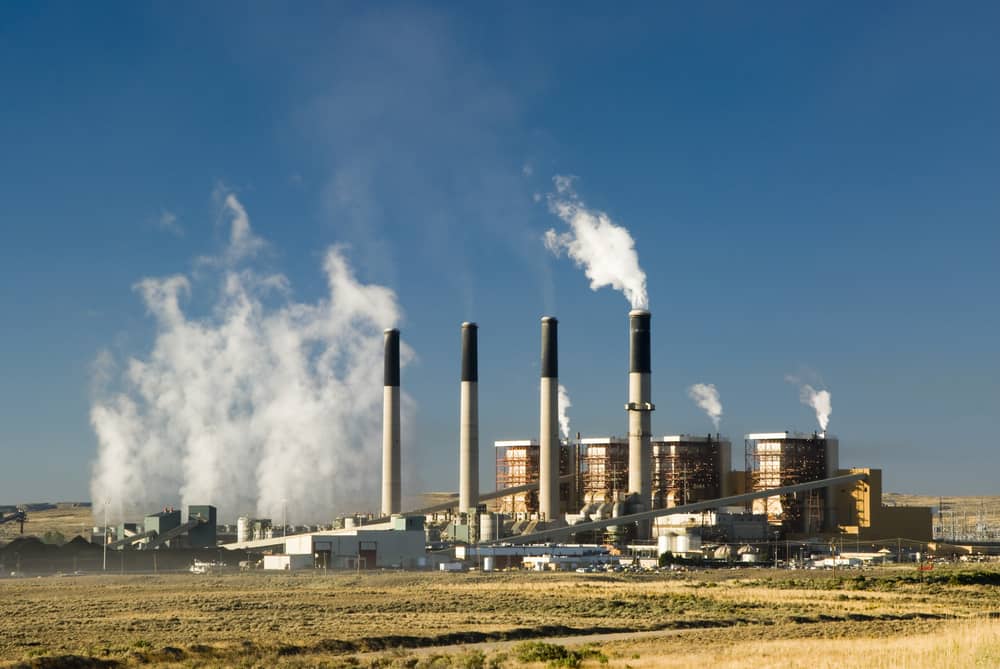
1. Wyoming
- Per capita annual CO2 emissions (tons): 109.9
- Total annual CO2 emissions (tons): 63,600,000
- Sector that emits the most CO2: Electric Power
- Fuel that emits the most CO2: Coal
RELATED
Almost 80% of Wyoming’s electricity is still generated from coal, amounting to an annual wattage of 33,359,104 MWh.
Detailed Findings & Methodology
The data used in this analysis is from the U.S. Energy Information Administration’s Environment Dataset and the U.S. Census Bureau’s American Community Survey.
To determine the states with the largest carbon footprint, researchers calculated per capita annual CO2 emissions. In the event of a tie, the state with the higher total annual CO2 emissions was ranked higher.
All state-level data shown is for 2018 (the most recent available); national-level data is for 2019.
Update history
This page was revised 1 time in February 2022.
Added new statistic about Wyoming's coal-generated electricity and annual wattage output to strengthen the emissions data.
The Commodity Briefing
The stories behind the prices. Surprising, useful, occasionally weird - in your inbox every weekday.
- Price moves
- Supply shocks
- Macro drivers
Before you go
Get The Commodity Briefing - free, 2 minutes.