In the ongoing efforts to combat global climate change, one of the most promising trends has been a growing shift away from carbon-emitting vehicles. Transportation produces 29% of greenhouse gas emissions in the U.S., according to the EPA, but hybrid and electric vehicles are growing in popularity and potentially poised to reduce that figure.
Part of this shift has come with encouragement from policymakers. Recognizing the role that fuel emissions play in contributing to the greenhouse gas effect and climate change, policymakers at all levels have been encouraging a transition toward lower, or zero-emission vehicles.
Hybrid and electric vehicle owners are often eligible for government incentives like tax credits. States like California are planning to phase out new carbon-emitting vehicles from the market altogether by 2035. More recently, the Biden Administration and Congress have been making efforts to expand the national network of electric vehicle charging stations among other climate-related infrastructure projects.
Simultaneously, the market for hybrid and electric cars has never been larger. In October, electric vehicle market leader Tesla became one of only a handful of companies ever to reach a $1 trillion market capitalization, following a surge in sales and the announcement of a $4 billion partnership with Hertz to provide 100,000 rental vehicles.
Meanwhile, entrenched auto industry manufacturers like GM, Toyota, BMW, and many others are racing to catch up to Tesla, offering an increasingly large variety of high-performing vehicles that have greater fuel economy and lower-to-no emissions.
And over the last few months, some consumers have been looking to the electric vehicle market for another reason: rising gasoline prices.
RELATED
The Commodity.com research team also gathered data on the highest-paying jobs in the oil and gas industry. The annual average for the leading role is just over $200,000.

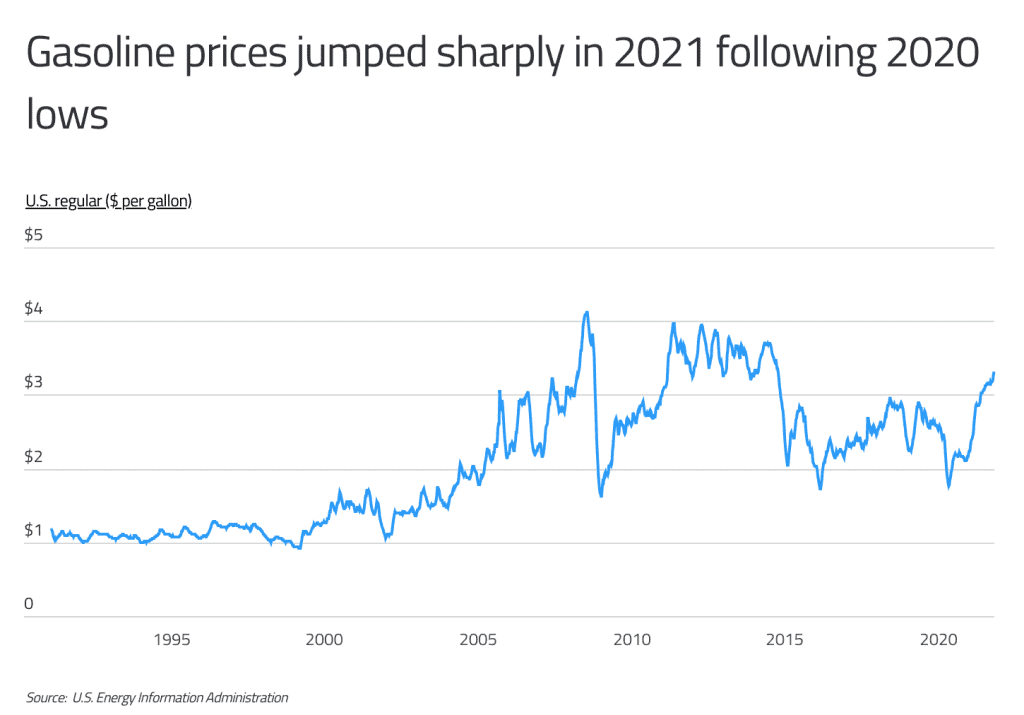
Gasoline prices have been fairly volatile over the last two decades, and the trajectory of gas prices during the COVID-19 pandemic provides one example. At the beginning of 2020, the average cost of a gallon of gas was $2.58.
By the end of April, after the pandemic had taken hold and with lockdown orders still in effect in many jurisdictions, gasoline dipped to $1.77 per gallon. After staying under $2.25 for the rest of 2020, gas prices have dramatically increased this year, rising to $3.32 per gallon as of October 2021.
Even with elevated gas prices, however, consumption is likely to remain high until more hybrids and electric vehicles are on the road. Studies have found that demand for gas is mostly inelastic, meaning that people tend to purchase the same amount of gas regardless of the price.
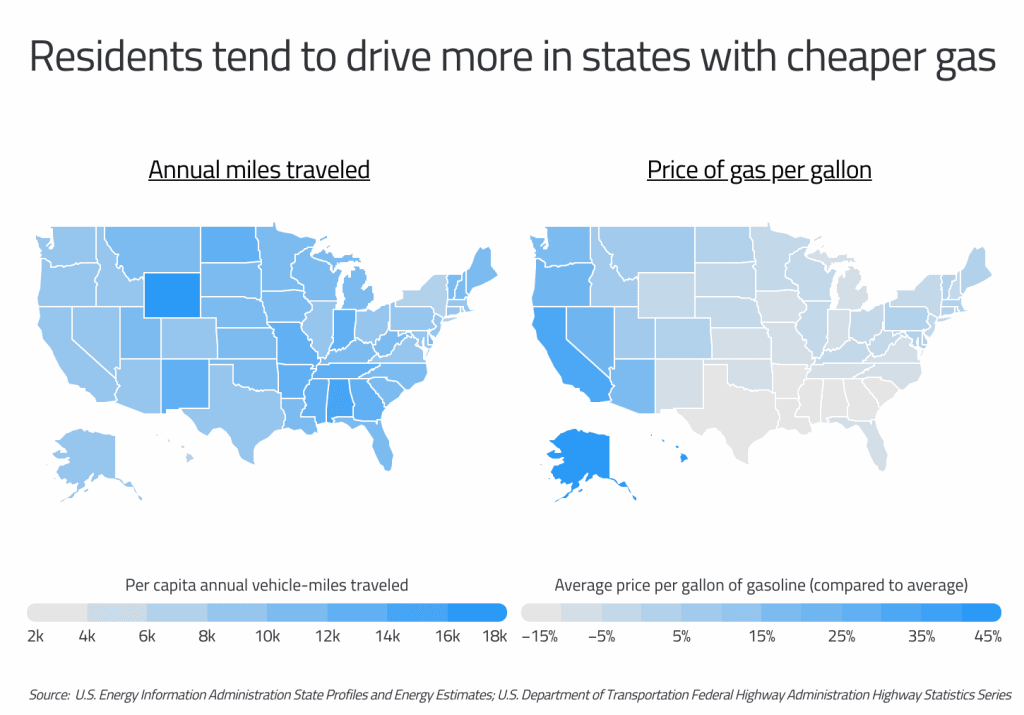
However, there does appear to be some correlation between the costs of gasoline in a state and the amount of miles drivers travel on the road.

RELATED
There are several factors to consider when choosing a commodity broker, including the account type, fees, and platform features. Be informed, and browse our guide to choosing commodity brokers before you get started.
The states with the least expensive gasoline relative to the national average are primarily found in the South. Reasons for this include these states’ proximity to major petroleum sources or refineries in Texas and the Gulf Coast region, which lowers distribution costs and gas taxes.
Many of these states, like Mississippi, Alabama, and South Carolina, are also among the leaders in per capita vehicle miles traveled annually. In contrast, states in the West and Northeast have much higher costs of gasoline, and their drivers spend less time on the road.
For instance, California has the third-highest gas prices of any state in the U.S. and ranks 42nd in vehicle miles traveled per person.
When it comes to gasoline consumption, vehicle miles traveled is also a major indicator. Rural states, mostly in the South, Midwest, and Mountain West, rank highly on both gasoline consumption and miles traveled because of their lower density and lack of other transportation alternatives.
To determine the states consuming the most gasoline, researchers at Commodity.com calculated per capita annual gasoline consumption in gallons using data from the U.S. Energy Information Administration and the U.S. Department of Transportation. In the event of a tie, the state with the higher per capita annual gasoline expenditures was ranked higher.
Here are the states consuming the most gasoline.
States That Consume the Most Gasoline Per Person

15. Iowa
- Per capita annual gasoline consumption (gallons): 492
- Per capita annual gasoline expenditures: $1,203
- Total annual gasoline consumption (gallons): 1,553,573,619
- Total annual gasoline expenditures: $3,801,000,000
- Average price per gallon of gasoline (compared to average): -5.9%
- Per capita annual vehicle-miles traveled: 10,601

14. Kentucky
- Per capita annual gasoline consumption (gallons): 497
- Per capita annual gasoline expenditures: $1,237
- Total annual gasoline consumption (gallons): 2,223,504,645
- Total annual gasoline expenditures: $5,531,000,000
- Average price per gallon of gasoline (compared to average): -4.3%
- Per capita annual vehicle-miles traveled: 11,036
DID YOU KNOW?
You can be prepared for when Plus500 becomes available in the United States with a Plus500 demo account that allows traders to test ideas and familiarize themselves with real market conditions in a risk-free environment. The demo allows for trading with fictitious money. Here’s more info and a full Plus500 review.

13. Tennessee
- Per capita annual gasoline consumption (gallons): 501
- Per capita annual gasoline expenditures: $1,209
- Total annual gasoline consumption (gallons): 3,418,976,274
- Total annual gasoline expenditures: $8,258,000,000
- Average price per gallon of gasoline (compared to average): -7.1%
- Per capita annual vehicle-miles traveled: 12,036

12. Montana
- Per capita annual gasoline consumption (gallons): 502
- Per capita annual gasoline expenditures: $1,390
- Total annual gasoline consumption (gallons): 537,487,105
- Total annual gasoline expenditures: $1,487,000,000
- Average price per gallon of gasoline (compared to average): +6.4%
- Per capita annual vehicle-miles traveled: 11,931

11. Texas
- Per capita annual gasoline consumption (gallons): 505
- Per capita annual gasoline expenditures: $1,159
- Total annual gasoline consumption (gallons): 14,645,221,408
- Total annual gasoline expenditures: $33,594,000,000
- Average price per gallon of gasoline (compared to average): -11.8%
- Per capita annual vehicle-miles traveled: 9,817
RELATED
Texas is also the largest producer of crude oil with over 1.7 billion barrels each year. It’s also the tenth most dependant state on fossil fuels.

10. Arkansas
- Per capita annual gasoline consumption (gallons): 505
- Per capita annual gasoline expenditures: $1,165
- Total annual gasoline consumption (gallons): 1,524,939,471
- Total annual gasoline expenditures: $3,520,000,000
- Average price per gallon of gasoline (compared to average): -11.2%
- Per capita annual vehicle-miles traveled: 12,242

9. Missouri
- Per capita annual gasoline consumption (gallons): 509
- Per capita annual gasoline expenditures: $1,209
- Total annual gasoline consumption (gallons): 3,127,887,990
- Total annual gasoline expenditures: $7,427,000,000
- Average price per gallon of gasoline (compared to average): -8.7%
- Per capita annual vehicle-miles traveled: 12,870

8. South Dakota
- Per capita annual gasoline consumption (gallons): 523
- Per capita annual gasoline expenditures: $1,325
- Total annual gasoline consumption (gallons): 464,451,253
- Total annual gasoline expenditures: $1,176,000,000
- Average price per gallon of gasoline (compared to average): -2.6%
- Per capita annual vehicle-miles traveled: 11,114

7. New Hampshire
- Per capita annual gasoline consumption (gallons): 532
- Per capita annual gasoline expenditures: $1,356
- Total annual gasoline consumption (gallons): 724,194,683
- Total annual gasoline expenditures: $1,845,000,000
- Average price per gallon of gasoline (compared to average): -2.0%
- Per capita annual vehicle-miles traveled: 10,121

6. South Carolina
- Per capita annual gasoline consumption (gallons): 549
- Per capita annual gasoline expenditures: $1,261
- Total annual gasoline consumption (gallons): 2,834,788,130
- Total annual gasoline expenditures: $6,506,000,000
- Average price per gallon of gasoline (compared to average): -11.7%
- Per capita annual vehicle-miles traveled: 11,104

5. Delaware
- Per capita annual gasoline consumption (gallons): 561
- Per capita annual gasoline expenditures: $1,457
- Total annual gasoline consumption (gallons): 547,438,138
- Total annual gasoline expenditures: $1,423,000,000
- Average price per gallon of gasoline (compared to average): +0.0%
- Per capita annual vehicle-miles traveled: 10,382

4. Wyoming
- Per capita annual gasoline consumption (gallons): 569
- Per capita annual gasoline expenditures: $1,474
- Total annual gasoline consumption (gallons): 330,146,731
- Total annual gasoline expenditures: $855,000,000
- Average price per gallon of gasoline (compared to average): -0.4%
- Per capita annual vehicle-miles traveled: 17,530

3. Alabama
- Per capita annual gasoline consumption (gallons): 570
- Per capita annual gasoline expenditures: $1,301
- Total annual gasoline consumption (gallons): 2,798,198,295
- Total annual gasoline expenditures: $6,385,000,000
- Average price per gallon of gasoline (compared to average): -12.2%
- Per capita annual vehicle-miles traveled: 14,576

2. North Dakota
- Per capita annual gasoline consumption (gallons): 577
- Per capita annual gasoline expenditures: $1,498
- Total annual gasoline consumption (gallons): 440,308,622
- Total annual gasoline expenditures: $1,144,000,000
- Average price per gallon of gasoline (compared to average): +0.0%
- Per capita annual vehicle-miles traveled: 12,839
TRENDING
A Contract-for-Differences — or CFD — is a type of financial product that allows traders to speculate on the price movements of an underlying asset like gold or oil instead of taking physical ownership of the product. Learn more about CFDs and brokers in our comprehensive CFD broker guide.

1. Mississippi
- Per capita annual gasoline consumption (gallons): 578
- Per capita annual gasoline expenditures: $1,324
- Total annual gasoline consumption (gallons): 1,722,554,239
- Total annual gasoline expenditures: $3,943,000,000
- Average price per gallon of gasoline (compared to average): -11.9%
- Per capita annual vehicle-miles traveled: 13,850
Detailed Findings & Methodology
The data used in this analysis is from the U.S. Energy Information Administration’s State Profiles and Energy Estimates and the U.S. Department of Transportation Federal Highway Administration’s Highway Statistics Series.
To determine the states consuming the most gasoline, researchers calculated per capita annual gasoline consumption in gallons.
In the event of a tie, the state with the higher per capita annual gasoline expenditures was ranked higher.
!function(e,i,n,s){var t=”InfogramEmbeds”,d=e.getElementsByTagName(“script”)[0];if(window[t]&&window[t].initialized)window[t].process&&window[t].process();else if(!e.getElementById(n)){var o=e.createElement(“script”);o.async=1,o.id=n,o.src=”https://e.infogram.com/js/dist/embed-loader-min.js”,d.parentNode.insertBefore(o,d)}}(document,0,”infogram-async”);

