
As the global economy continues to expand, the need for energy to sustain that growth is increasing as well.
People and businesses depend on energy for every aspect of life, from heating and cooling homes and workplaces to fueling transportation to powering appliances and other conveniences of modern life. As demand increases, energy producers must find ways to keep up, either by increasing production or by producing more energy from existing inputs.
Energy efficiency creates a number of benefits for the economy overall. Consumers and businesses that rely on energy benefit from lower prices because it is easier to meet demand with lower levels of energy production.
Utilities and other energy producers can save on the cost of energy production and transmission infrastructure with more efficient generation. And more efficient energy use also has environmental advantages: efficient energy production releases lower levels of greenhouse gaseses and other pollutants, and it requires less water.
With greater needs and these benefits in mind, businesses and governments have developed more tools to promote energy efficiency in recent decades. Utilities have developed more efficient technologies for generating energy and moved away from less efficient fuel sources. Many states and localities have adopted policies like Energy Efficiency Resource Standards or more stringent building codes to ensure continued improvements in energy efficiency.
Programs like the LEED (Leadership in Energy and Environmental Design) certification for buildings and the government’s ENERGY STAR certification for consumer appliances have helped raise standards of energy efficiency for many aspects of everyday life.
But one of the biggest factors improving energy efficiency is a shift in the nature of the U.S. economy. Historically, the U.S. generated a far greater share of its economic output from energy-intensive industries like manufacturing. Over time, more of the economy has shifted toward services and technology, which require far less energy input, and the energy intensity of the economy has declined over time.
According to the U.S. Energy Information Administration, the amount of energy consumption relative to GDP has decreased by 58% since 1950.
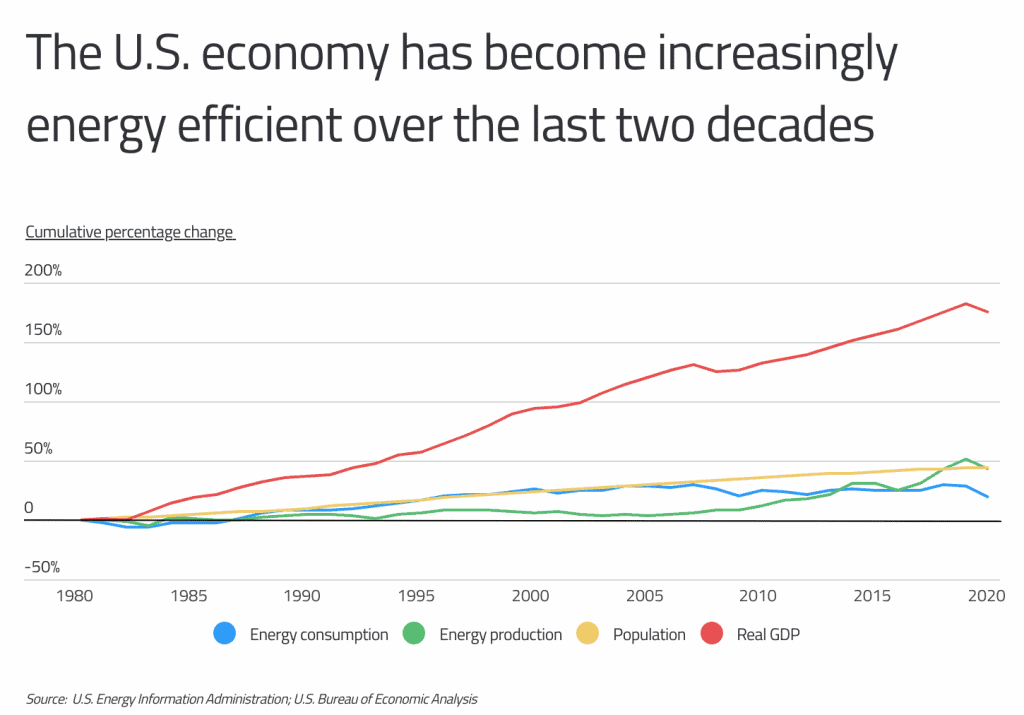
The result of these collective shifts has contributed to improved efficiency across the U.S. economy. From 1980 into the mid-2000s, the growth in energy consumption mostly tracked population growth: as the U.S. added more people, it also consumed more energy. Since then, however, energy consumption has begun to decline, while population and GDP have continued to grow.
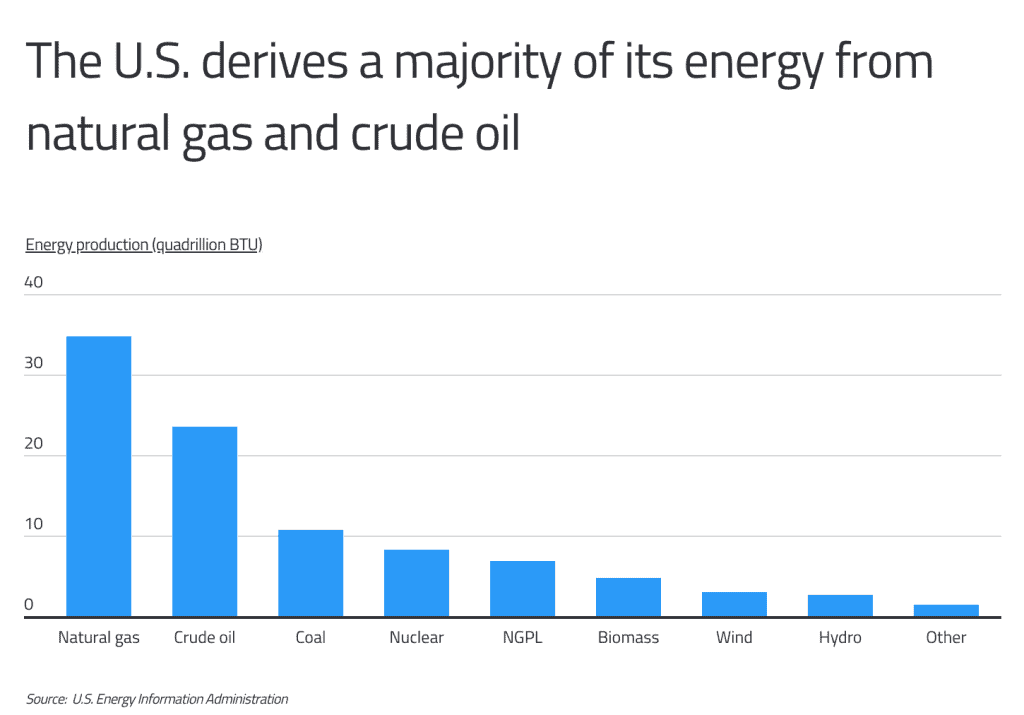
The U.S. also has room to continue improving in the efficiency of its energy production, thanks to an increasingly diverse – and more efficient – mix of energy sources. Fossil fuels including natural gas (34 quadrillion BTU), crude oil (23.6), and coal (10.7) constitute a sizable majority of U.S. energy production.
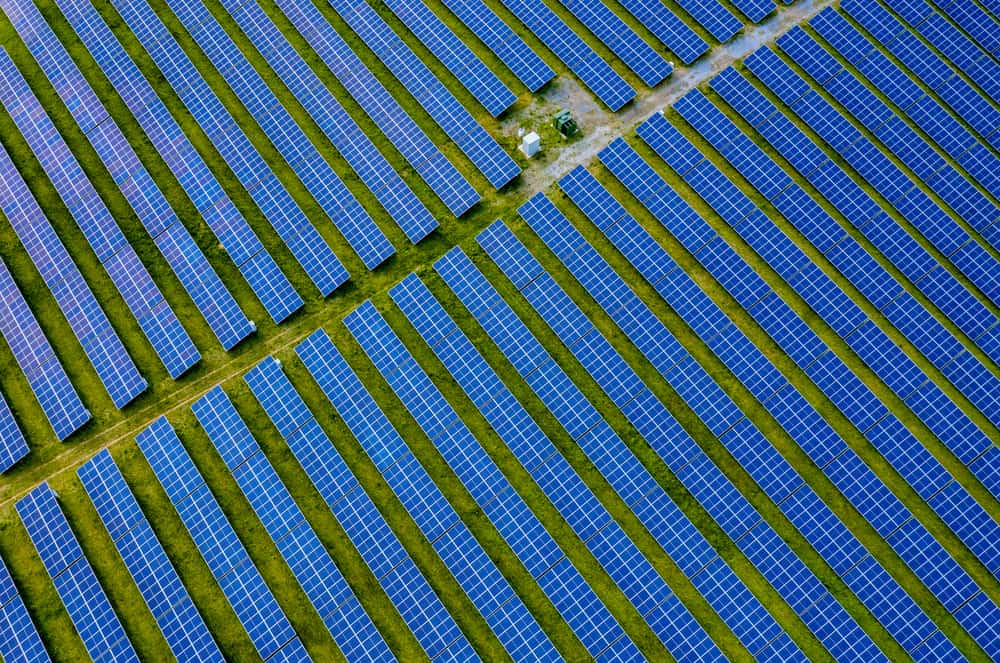
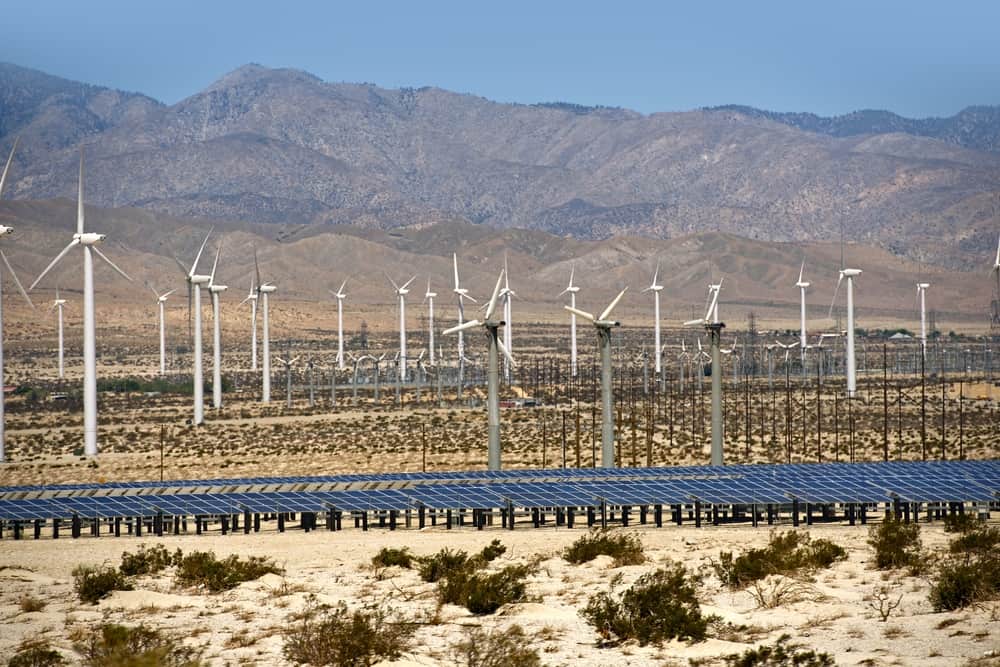
However, energy production from fossil fuels has moved away from highly inefficient coal and toward more efficient natural gas in recent years, and other alternatives, including renewables like wind, have become a much more significant portion of the U.S. mix.
TRENDING
If you’re unfamiliar with what to look for when choosing a broker, you might want to see our seven key factors to consider, including the account types offered and the various fees. Get the rest in our guide to choosing commodity brokers.
In the meantime, some states are further along than others in advancing energy efficiency goals. Several factors explain why. Many of the leading states have stronger policies and standards regulating energy efficiency in utilities, buildings, or products like vehicles and appliances.
Others have sped their transitions away from more inefficient fossil fuels toward efficient renewable sources with new investments and regulations. And some benefit from other economic and demographic factors, like the aforementioned shift toward less energy-intensive industries or densely populated urban areas, which promote energy efficiency in buildings and transportation.
Together, these factors have put states like New York, Massachusetts, and California toward the top of the list of most energy-efficient locations.
To determine the states with the most energy-efficient economies, researchers at Commodity.com analyzed the latest data from the U.S. Energy Information Administration and the Bureau of Economic Analysis. The researchers used this data to rank states by their total energy consumption per GDP. In addition, the total energy consumption per capita, total energy consumption, and total GDP were provided for reference.
Here are the states with the most energy-efficient economies.
States With the Most Energy Efficient Economies

15. Oregon
- Total energy consumption per GDP (BTU per dollar): 4,168.3
- Total energy consumption per capita (million BTU per capita): 243.8
- Total energy consumption (trillion BTU): 1,028.1
- Total GDP (billion dollars): $246.65
DID YOU KNOW?
Many brokers offer demo accounts, but the one from Plus500 stands out for three reasons: You can keep it open for an unlimited time, you can open one without having to open a real money account, and it’s ready to practice trading within minutes after the sign-up process. Read all about the good and bad aspects of Plus500 in our comprehensive Plus500 review.

14. Colorado
- Total energy consumption per GDP (BTU per dollar): 4,019.4
- Total energy consumption per capita (million BTU per capita): 273.8
- Total energy consumption (trillion BTU): 1,576.5
- Total GDP (billion dollars): $392.22

13. Vermont
- Total energy consumption per GDP (BTU per dollar): 4,011.4
- Total energy consumption per capita (million BTU per capita): 219.4
- Total energy consumption (trillion BTU): 136.9
- Total GDP (billion dollars): $34.13
12. Florida
- Total energy consumption per GDP (BTU per dollar): 3,920.0
- Total energy consumption per capita (million BTU per capita): 203.8
- Total energy consumption (trillion BTU): 4,376.4
- Total GDP (billion dollars): $1,116.44
11. Delaware
- Total energy consumption per GDP (BTU per dollar): 3,848.5
- Total energy consumption per capita (million BTU per capita): 304.5
- Total energy consumption (trillion BTU): 296.5
- Total GDP (billion dollars): $77.04

10. New Hampshire
- Total energy consumption per GDP (BTU per dollar): 3,654.5
- Total energy consumption per capita (million BTU per capita): 235.2
- Total energy consumption (trillion BTU): 319.8
- Total GDP (billion dollars): $87.51

9. Washington
- Total energy consumption per GDP (BTU per dollar): 3,472.3
- Total energy consumption per capita (million BTU per capita): 272.6
- Total energy consumption (trillion BTU): 2,076.0
- Total GDP (billion dollars): $597.87

8. Hawaii
- Total energy consumption per GDP (BTU per dollar): 3,350.4
- Total energy consumption per capita (million BTU per capita): 217.2
- Total energy consumption (trillion BTU): 307.5
- Total GDP (billion dollars): $91.78

7. New Jersey
- Total energy consumption per GDP (BTU per dollar): 3,285.1
- Total energy consumption per capita (million BTU per capita): 236.5
- Total energy consumption (trillion BTU): 2,100.6
- Total GDP (billion dollars): $639.44
6. Maryland
- Total energy consumption per GDP (BTU per dollar): 3,208.2
- Total energy consumption per capita (million BTU per capita): 223.7
- Total energy consumption (trillion BTU): 1,352.6
- Total GDP (billion dollars): $421.61

5. Rhode Island
- Total energy consumption per GDP (BTU per dollar): 3,103.4
- Total energy consumption per capita (million BTU per capita): 179.6
- Total energy consumption (trillion BTU): 190.3
- Total GDP (billion dollars): $61.32
4. California
- Total energy consumption per GDP (BTU per dollar): 2,555.9
- Total energy consumption per capita (million BTU per capita): 197.5
- Total energy consumption (trillion BTU): 7,802.3
- Total GDP (billion dollars): $3,052.65

3. Connecticut
- Total energy consumption per GDP (BTU per dollar): 2,554.6
- Total energy consumption per capita (million BTU per capita): 206.4
- Total energy consumption (trillion BTU): 736.0
- Total GDP (billion dollars): $288.11
RELATED
With CFDs, traders can make a profit regardless of whether an asset’s price increases or decreases, as long as they predict the correct direction – and speed – of the price change. Here’s more information on CFDs and CFD brokers.

2. Massachusetts
- Total energy consumption per GDP (BTU per dollar): 2,474.3
- Total energy consumption per capita (million BTU per capita): 213.0
- Total energy consumption (trillion BTU): 1,467.9
- Total GDP (billion dollars): $593.26

1. New York
- Total energy consumption per GDP (BTU per dollar): 2,169.0
- Total energy consumption per capita (million BTU per capita): 198.2
- Total energy consumption (trillion BTU): 3,855.9
- Total GDP (billion dollars): $1,777.75
Methodology & Detailed Findings
To determine the states with the most energy-efficient economies, researchers at Commodity.com analyzed the latest data from the U.S. Energy Information Administration, the Bureau of Economic Analysis, and the U.S. Census Bureau.
The researchers used this data to rank states by their total energy consumption per GDP.
In addition, the total energy consumption per capita, total energy consumption, and total GDP were provided for reference.
Update history
This page was revised 2 times in March 2022.
Added extensive content explaining energy efficiency factors, economic shifts, policy impacts, and state rankings, plus 15 photo credits throughout the article.
Added introductory paragraphs explaining energy efficiency benefits and economic shifts, plus photo credits for all 15 state rankings.
The Commodity Briefing
The stories behind the prices. Surprising, useful, occasionally weird - in your inbox every weekday.
- Price moves
- Supply shocks
- Macro drivers
Before you go
Get The Commodity Briefing - free, 2 minutes.