In this guide to understanding the Commodity Select Index (CSI), we’ll show you what this chart looks like, explain its components, and teach you how to interpret it.
Conteúdo
What Is the Commodity Select Index (CSI)?
The Commodity Select Index (CSI) was intended by Welles Wilder to be used to select the best commodity to trade by weighing the volatility and trending characteristics of each futures market.
What Does the CSI Look Like?
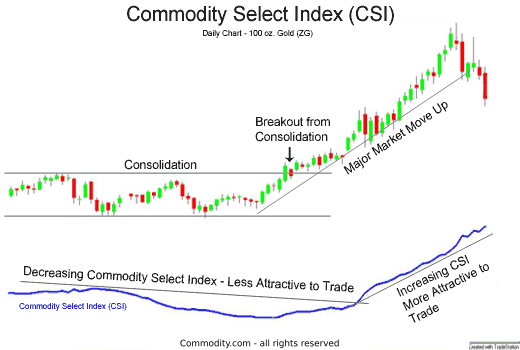
The chart below of the 100 oz. Gold Futures contract illustrates the Commodity Select Index:
What Are the Components of the CSI?
- Directional Movement
- Market Volatility
- Margin Requirements for the futures contract
- Commission Costs
The Commodity Select Index is usually calculated over 14-periods and includes the ADXR in its calculation.
What Does the CSI Indicate?
According to Wilder, the higher the Commodity Select Index the better the risk-reward setup.
Resumo
The Commodity Select Index is yet another technical indicator created by Welles Wilder and chronicled in his popular book, New Concepts in Technical Trading Systems.
Corretoras regulamentadas: Onde posso negociar commodities?
Comece sua pesquisa com as análises dessas corretoras regulamentadas disponíveis em .
Os CFDs são instrumentos complexos e apresentam um alto risco de perda rápida de dinheiro devido à alavancagem. Entre 74% e 89% das contas de investidores de varejo perdem dinheiro ao negociar CFDs. Você deve considerar se pode se dar ao luxo de correr o alto risco de perder seu dinheiro.
PERGUNTAS FREQUENTES
Below are some commonly asked questions about the CSI.
What is a momentum indicator?
A momentum indicator like the Commodity Select Index shows the difference between the price of an asset today and its previous price during a given timeframe. It can be helpful in identifying price uptrends or downtrends. If the momentum indicator is positive, that means an uptrend in the price is sustained, but if the indicator is negative, it means that the price is trending downward.
Leitura adicional
Saiba mais sobre indicadores, conceitos e estratégias de análise técnica, incluindo:
- Índice de massa
- Índice de retorno de Herrick
- Índice de Movimento Direcional
- Índice do Canal de Commodities
- RSI estocástico
- Índice de oscilação
- RSI estocástico
- Índice de úlcera